Longitudinal trajectories of region-level suicide mortality in Tokyo, Japan, 2011 to 2021
Asuka Suzuki1, Kazue Yamaoka1*, Mariko Inoue1, Toshiro Tango2,1
1Teikyo University Graduate School of Public Health, Tokyo, Japan
2Center for Medical Statistics, Tokyo, Japan
Abstract
Background: Suicide mortality in Japan has declined over a period of more than 10 years, however, differences in longitudinal trajectories at a regional level are not well characterized. Objective was to clarify the longitudinal suicide mortality trajectories at the regional level in Tokyo from 2011 to 2021 by considering spatial smoothing, before and during the COVID-19 pandemic.
Methods: This longitudinal cross-sectional analysis used fifty-four regions in Tokyo, Japan. Suicide mortality trends used data from the Cabinet Office of the Japanese government from 2011 to 2021. Regional social and environmental characteristics were used as 10 covariates. Empirical Bayes estimates for the standardized mortality ratio were obtained. A conditional autoregressive (CAR) model was applied to capture the spatial correlation for a crude and adjusted with 10 covariates using OpenBUGS. Spatial clusters were also identified by FlexScan, SaTScan, and Tango’s test.
Results: Longitudinal trajectories for both males and females were similar to a decreasing trend in all Japan until 2019. In 2020, the beginning of the COVID-19 pandemic, the age-specific suicide deaths were the highest among those in their 20s. However, those were the highest among males in their 50s in 2021. The results of the CAR models adjusted for 10 covariates detected several regions as having higher suicide rates, but those regions were somewhat varied.
Conclusion: During the COVID-19 pandemic, both sexes in their 20s and males in their 50s showed a tendency toward an increase in suicides. The detected regions by spatial epidemiology varied with sex.
Introduction
According to Japan's National Police Agency, the monthly number of suicides in Japan rose to over 2000 in October 2020, and suicide claimed more lives than COVID-19 during 20201 and continued until 2021. Further, COVID-19 resulted in economic distress and is one of the direct or indirect factors such as mental stress, loneliness, stress and social separation resulting from lockdown for the increase in the number of suicides. The World Health Organization (WHO) has tackled the problem of suicide deaths in its Comprehensive Mental Health Action Plan2,3 as a critical global public health issue. Suicide mortality in Japan is the second highest among Asian countries, and suicide prevention continues to be a significant health issue due to the magnitude of the impact of suicides4.
In the former study, we examined the regional status of current suicide deaths in Kanagawa Prefecture as a useful tool for evaluating by the community5. A recent report analyzed whether suicide mortality changed during the COVID-19 pandemic based on month-level records of suicides covering the entire Japanese population6. In Tokyo, suicide prevention measures have been continuously implemented; however, regional variation and the impact of the COVID-19 pandemic since 2020 should be of concern.
So far, several studies have used spatial epidemiologic technics not only for infectious diseases but also for spatial-temporal suicide trends7 and suicide risk around the world5,8-11. Factors related to community characteristics were analyzed and the young and the older adults were indicated to belong to highly vulnerable and marginalized groups. Suicide prevention is an important priority in policy making. Spatial statistics are widely used to detect geographical disease clusters for analyses of population status using regional data. The use of spatial correlations of suicide deaths can provide valuable information on the extent of spatial spreading12,13.
In Japan, differences in longitudinal trajectories among residents at a regional level in Japan are not well characterized. The implications of COVID-19 pandemic, which has put the nation under attack since 2020, are of concern. We examined spatial clustering of suicide mortality in Tokyo using data from regional statistics on male and female suicide deaths from 2011 to 2021, before and after the onset of the COVID-19 pandemic. From the longitudinal trajectories, the impacts of COVID-19 was also examined.
Methods
This longitudinal cross-sectional analysis used regional statistics (54 regions in Tokyo) derived from the national vital statistics reported by the Cabinet Office of the Japanese government from 2011 to 2021 (e-Stat)14. Data on the number of suicide deaths according to region were based on information from the National Police Agency. In this study, we examined the regional variation in the status of suicide risk using the approach of “borrowing strength” in spatial epidemiology. We principally examined the following two questions: (i) are there any spatial clusters of suicide deaths in Tokyo according to the Conditional Autoregressive (CAR) model that assumed a spatial correlation and the 3 tests for detecting clusters as well, and ii) are the impacts of COVID-19 detected in the longitudinal trajectories by considering regional variation. Regional social and environmental characteristics were used as 10 covariates for the CAR model. The CAR model was applied to capture the spatial correlation for a crude and adjusted with 10 covariates using OpenBUGS.
Measures
Age-specific vital statistics for suicide were used and standardized mortality was calculated. We classified age into 8 groups (≤19, 20–29, 30–39, 40–49, 50–59, 60–69, 70–79, 80+years). We obtained regional data for 2011 in 10 topics as covariates from the Japanese National Census14 such as the proportion of single households (%), average family size, population density (persons/km2), number of general clinics (per 1000 individuals), the proportion of foreigners (%), workforce [per 1000 workers (all workers and unemployed people over the age of 15)], unemployment (%), average income (10000 yen), number of criminals recognized, and the proportion of residents aged 65 years or older (%). Because population characteristics from these regional data did not largely vary during the above mentioned 10-year period, 2011 data were used as baseline covariates in the analyses. All unknown data were excluded from the analysis. We used regional vital statistics provided by the National government (the Cabinet Office). The summarized data by region in each prefecture were provided and we treated the unknown as missing.
Statistical analyses
Most likely clusters have been detected by cluster detection tests such as Tango-Takahashi’s flexible spatial scan statistic using the software Flexible Scan (FlexScan)17and Kulldorff’s circular spatial scan statistic (spatial, temporal, or space-time scan statistics; SaTScan.)18,19 (FlexScan includes Kulldorff’s circular spatial scan statistic.) Further, “hotspot” has been examined by Tango’s test using “Disease Mapping System (DMS)” software provided by Tango20. The spatial scan statistics implemented by FleXScan and SaTScan offer several advantages over other techniques for detecting disease clusters. Spatial scan statistics may be changed by model assumptions. Consequently, we applied these models and checked whether similar results were obtained despite the various assumptions. The focus of this paper was on comparing various models with different assumptions to find similar results.
In this study, we focused on the detection of spatial clustering of suicide mortality and related community characteristics in Tokyo from 2011 to 2021. The CAR model was used to estimate of θi and the estimates of regression coefficients of covariates βi by taking spatial correlations θi into account15. The estimates were shown with 95%CI (95% credible interval) (in tables) as well as the estimated region’s suicide mortality using 5 levels (in maps). Ten covariable models were conducted. All analyses were performed according to sex. OpenBUGS was used for the analysis and is the open-source variant of WinBUGS (Bayesian inference Using Gibbs Sampling)16. For details of the indices for standardized mortality formula, see Appendix.
For the expected number of deaths “e,” we used 10 covariates only for the CAR model, not for the other models.
Results
Figure 1 shows the longitudinal trajectories for suicide by sex. Those in Tokyo showed similar decreasing trend all over Japan until 2019. Although the total suicide rates for each year examined in Tokyo were lower than the national rates for males, they were higher for females. As for age, suicide deaths for males and females in their 20s tended to increase in 2020 among age groups and both sexes in their 20s, and the rates were the highest. However, those were the highest among males in their 50s while those were the highest in females in their 20s in 2021.
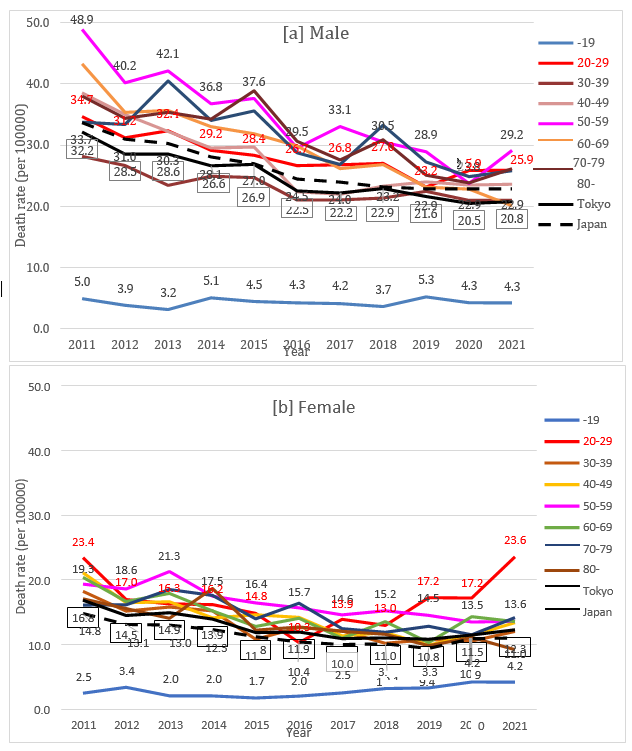
Figure 1: Longitudinal trajectory of suicide death rates according by age groups in Tokyo: 2011 to 2021. ([a] Male, [b] Female) Note: Death rate per 100000 persons.
As for the characteristics of suicides by sex, being in the 40s (18.8% and 18.0% for males and females, respectively), being unemployed (51.1% and 66.5% for males and females, respectively), and having health problems (34.3% and 48.6% for males and females, respectively) were comparatively frequent (Table 1). Characteristics of the variables are summarized in Supplementary File 1 with mean values, minimum and maximum values, and corresponding regional codes. The proportions of single households and foreigner residents were the highest in a downtown (Code 104).
Table 1: Characteristics of suicides by sex in Tokyo, Japan, 2011-2021.
|
Male |
% |
Female |
% |
||
|
Total |
17582 |
100 |
12122 |
100 |
|
|
Age groups (years) |
Under 20th |
500 |
2.8% |
368 |
3.0% |
|
20-29 |
2460 |
14.0% |
1816 |
15.0% |
|
|
30-39 |
2615 |
14.9% |
1833 |
15.1% |
|
|
40-49 |
3303 |
18.8% |
2181 |
18.0% |
|
|
50-59 |
3139 |
17.9% |
1922 |
15.9% |
|
|
60-69 |
2511 |
14.3% |
1721 |
14.2% |
|
|
70-79 |
2000 |
11.4% |
1391 |
11.5% |
|
|
Over 80th |
1024 |
5.8% |
866 |
7.1% |
|
|
Unknown |
30 |
0.2% |
11 |
0.1% |
|
|
Living alone |
Not alone |
9520 |
54.1% |
7551 |
62.3% |
|
Alone |
7779 |
44.2% |
4423 |
36.5% |
|
|
Unknown |
283 |
1.6% |
135 |
1.1% |
|
|
Occupation |
Self-employed |
1407 |
8.0% |
592 |
4.9% |
|
Employee |
6044 |
34.4% |
2944 |
24.3% |
|
|
Unemployed |
8982 |
51.1% |
8065 |
66.5% |
|
|
Unknown |
619 |
3.5% |
305 |
2.5% |
|
|
Suicide method |
Hanging |
10560 |
60.1% |
6774 |
55.9% |
|
Poison |
215 |
1.2% |
321 |
2.6% |
|
|
Firearm |
912 |
5.2% |
480 |
4.0% |
|
|
Jumping from a tall building |
2660 |
15.1% |
2287 |
18.9% |
|
|
Jumping in front of a train |
706 |
4.0% |
485 |
4.0% |
|
|
Other |
1931 |
11.0% |
1520 |
12.5% |
|
|
Unknown |
68 |
0.4% |
39 |
0.3% |
|
|
Causes and motivea |
Family problem |
1626 |
9.2% |
1527 |
12.6% |
|
Health problem |
6033 |
34.3% |
5890 |
48.6% |
|
|
Economic and life problem |
3183 |
18.1% |
1229 |
10.1% |
|
|
Job-related problem |
1722 |
9.8% |
685 |
5.7% |
|
|
Gender issues |
489 |
2.8% |
565 |
4.7% |
|
|
School problem |
355 |
2.0% |
192 |
1.7% |
|
|
Other |
593 |
3.4% |
357 |
3.2% |
|
|
Unknown |
6796 |
38.7% |
4140 |
34.2% |
a: including multiple answers
The regions detected by the CAR models and several spatial tests by sex as regions with significantly higher relative risk are summarized in Table 2. A visual representation of the significantly detected regions is shown in Figure 2. In the maps, the region's relative risk of suicide (5 levels), estimated using the CAR model adjusted by 10 covariates, are also shown. The parameter estimates of the covariates with a 95% credible interval [lower and upper] are shown in Supplementary File 4. Regions detected 5 times or more in 11 years in one of the spatial models was considered a "frequently detected region." Those were somewhat varied among the spatial models, year, and sex. In this way, however, certain regional characteristics may emerge. Two downtowns (Code 104 and Code 116), and one old town (Code 121) were denoted as "frequently detected regions." However, the old town was a "frequently detected region" only in the case of males. In females, the downtown (Code 104) was detected in most years, especially by the CAR model adjusted by 10 covariates. This trend was confirmed by the region’s relative risk of suicide. Among the 10 covariates in the CAR model, significant hazardous effects on suicide were a large proportion of those under the age of 65 years old (for males) and in the workforce over 15 years old (for females). While the proportion of foreigner residents, the proportion of unemployment, and the number of criminal offenses recognized were detected as significant, significant associations varied by year and sex.
Table 2: Detected regions by spatial models.
|
Year |
2011 |
2012 |
2013 |
2014 |
2015 |
2016 |
2017 |
2018 |
2019 |
2020 |
2021 |
||||
|
Male |
|
||||||||||||||
|
Car model (10 covariates) |
111, 112, 121, 123, 201 |
111, 112, 119, 121, 123 |
106, 116, 121 |
- |
106, 121, 202, 213 |
104 |
104, 116, 118, 121, 202, 220 |
104, 106, 116, 118, 121, 202 |
104, 121 |
111, 112, 119, 121, 123, |
-a |
|
|||
|
Car model (no covariate) |
- |
106 |
- |
- |
106 |
- |
- |
121, 122 |
104, 121 |
- |
- |
|
|||
|
Tango's global test (p<0.05) |
- |
119, 121, 123 |
- |
- |
- |
- |
- |
121, 123 |
121, 122 |
- |
- |
|
|||
|
Kulldorff's SatScan (p<0.05) |
- |
106, 107, 118, 121, 122, 123 |
106 |
- |
202, 213, 220, 223 |
- |
106, 107, 108, 118, 121, 122, 123 |
- |
106, 107, 108, 118, 121, 122, 123 |
- |
- |
|
|||
|
FlexScan (p<0.05) |
- |
103, 104, 105, 106, 116 |
- |
- |
- |
- |
- |
- |
- |
- |
- |
|
|||
|
Female |
|
|
|||||||||||||
|
Car model (10 covariates) |
104, 116 |
104 |
104, 116, 117, 202 |
104, 116 |
104, 116 |
121 |
104, 106, 116, 118, 121, 202 |
104 |
104, 116 |
104, 114 |
104, 116, 218 |
|
|||
|
Car model (no covariate) |
- |
- |
- |
- |
- |
- |
- |
- |
- |
104 |
- |
|
|||
|
Tango's global test (p<0.05) |
- |
- |
- |
104 |
- |
121 |
- |
- |
- |
104 |
104 |
|
|||
|
Kulldorff's SatScan (p<0.05) |
- |
- |
- |
104 |
104 |
- |
- |
- |
- |
104 |
104 |
|
|||
|
FlexScan (p<0.05) |
101, 102, 103, 104, 109, 110, 112, 113, 116 |
- |
- |
104 |
- |
- |
- |
102, 104, 106, 108, 116, 117, 118, 119, 123 |
101, 102, 104, 106, 113, 114, 116, 117, 118, 120 |
101, 102, 104, 106, 114, 115, 116, 117 |
102, 104, 106, 108, 116, 117, 118, 119, 123 |
|
|||
a. Region Code 103 (Minato-ku) has detected as lower area.
Note: Region code (see Supplementary File 2)
CAR model by OpenBUGS (iterations=100000, Chain=2, Thining=10, Sample=20000) (regions 101 [Chiyoda] and 13400 [Islands] were excluded from the analysis.)
Estimates of related factors and statistics, see Supplementary File 3.
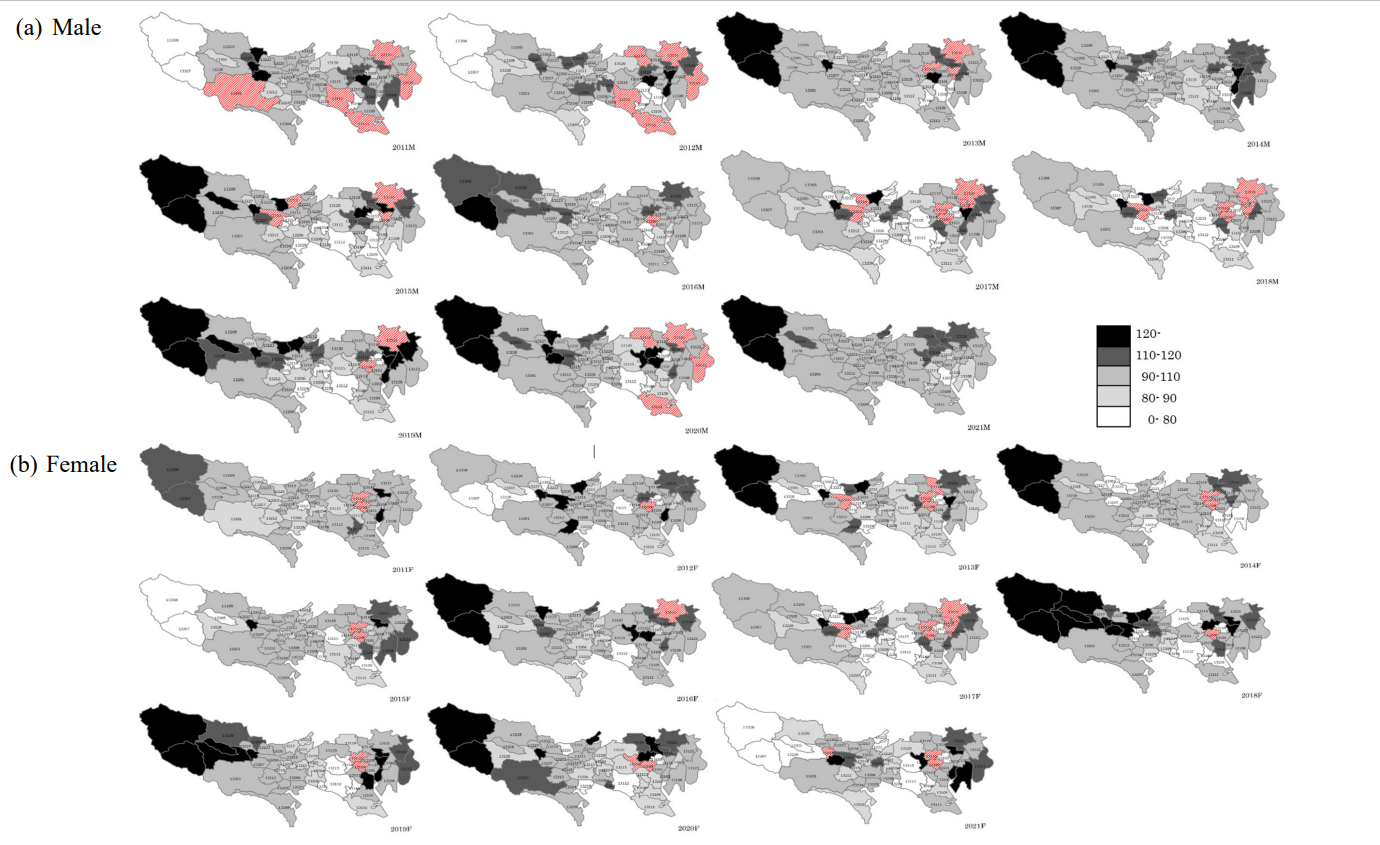
Figure 2: Region's relative risk of suicide (5 levels) estimated using the CAR model adjusted by 10 covariates for suicide deaths among those of all ages. Shaded area with red colour was significantly detected regions by the CAR model
Discussion
This longitudinal cross-sectional analysis of suicide mortality trends in Tokyo using vital statistics and census data from 2011 to 202114 showed that the longitudinal trajectories of suicides for both males and females had similar decreasing trends throughout Japan until for 2019. In 2020, the beginning of the COVID-19 pandemic, while age-specific suicide deaths were the highest among those in their 20s. However, those were the highest among males in their 50s in 2021.
Tokyo may seem like a single region, but it is diverse in its aspects and is divided into socioeconomically affluent and less affluent areas and has a different aging population. Recently, the division in lifestyles and living conditions between urban and suburban areas has also been reported21. Tokyo is the most populous region in Japan (with a population of around 14 million and more than 1/10 of Japan's population) and has the highest actual number of suicides in Japan. By examining the characteristics of areas in Tokyo with elevated suicide rates (especially during disaster periods such as COVID-19), we believe that the findings can be used for prevention in other areas of Japan, that have similar characteristics to those of the areas identified in this study. Clarifying the differences between regions and over time will have important implications for future suicide countermeasures. In this study, the impact of COVID-19 is secondary and limited in that it considers changes over time, including the period. The CAR model detected a significant regional clustering for both sexes throughout the longitudinal trajectories. In particular, the downtown (Code 104) has frequently been frequently detected as a region with many suicides among both males and females. The old town (Code 121) for males and the downtown (Code 116) for females were also frequently found. The environmental factors symbolized by population concentration had an unstable relationship with suicide mortality. The results showed evidence of hotspots of suicide mortality across regions in Tokyo by several spatial clustering methods and we examined the spatial correlation with the incidence of suicide adjusted for related factors.
The WHO report3 found that three times more males die by suicide than females in high-income countries. In Tokyo, this ratio suggests that roughly twice as many males as females committed suicide in all age groups (Figure 1 [a], [b]). Suicide deaths among males and females were more frequent in the 50s and in most years, until 2019. In 2020, the 20s were the age group with the highest rate of suicide deaths, both for males (25.9) and females (17.2), and in 2021, it was the highest in their 50s in males (29.2) while in females it was the highest in their 20s (23.6). Amazingly, the rates in their 20s became almost similar between males and females in 2021.
Previous studies on yearly or monthly trends in Japan's suicide rate have used the overall suicide rate in Japan22-27. In these studies, the impact of COVID-19 under a pandemic was tracked and evaluated for 2020. For instance, Sakamoto and colleagues23 reported that monthly suicide rates in Japan during the COVID-19 pandemic in 2020 increased in October and November for males and in July through November for females compared with 2016 to 2019. They reported that the relative increases were particularly pronounced for males and females under the age of 30 and between ages 30 to 49 years. While a study24 that examined monthly excess suicide rates during the COVID-19 pandemic showed the gender differences in reasons for suicide in Japan from January 2019 to May 2021, and they summarized age group by 20 years.
The point that the suicide deaths in males were twice that in females was like our findings until 2019. However, our results suggested that suicides among younger females tended to increase in several recent years, not in 2020 as that report indicated. Especially in 2021, the rate of females in their 20s becomes almost like that of male. One probable reason for these different tendencies was because our data were from Tokyo. Tokyo is the biggest urban city in Japan and the circumstances during the time examined were different from the average in Japan. According to the White paper4, many young females work in the service and food service sectors and may have been financially affected by unemployment and closures due to COVID-19. Although the rates were low in the youngest age group (under 19 years), the trend increased from 2016 in females, but not in males. This was because women, such as those in informal employment work, lost their jobs, mainly in the service sector, affected by absence and unemployment, and were economically vulnerable and isolated. However, during this pandemic period, the situation in Japan was diverse. It was necessary to separate the impact on non-metropolitan areas from that on metropolitan areas, rather than the Japanese average. This is because Tokyo was the area that received the most emergency declarations and other restrictions on behavior and needed to be discussed separately from other general Japanese averages. In fact, we showed the different female suicide rates in different parts of Tokyo.
The identified regions by spatial models showed interesting results. In the longitudinal trajectory, in the two downtowns (Code 104 and Code 116) suicides were frequently detected in most years for both males and females. However, a characteristic point was the difference between sex and age groups. Namely, regions with significant rates of suicide include the old town (Code 121); however, in the two downtowns (Code 104 and Code 116) such significant suicide rates were identified in females (See Supplementary File 4). Our study data could not explain the reason for this result. Especially for 2020 and 2021, the COVID-19 pandemic had complex effects on people’s lives. The old town (Code 121) is an area where small businesses account for about 80% of the businesses in the ward, and the proportion of the residents aged 65 years or older is high at 24.7% in 2017 (second highest in the 23 wards). Further, according to the ratio of government welfare-payment recipients to the total population in 23 Wards of Tokyo, the rates in the old town (Code 121) and the two downtowns (Code 104 and Code 116) were higher than the average in Tokyo27. One probable interpretation was that the two downtowns (Code 104 and Code 116) are among the most famous nightlife destinations in Tokyo and were characterized by business and commercial facilities around the railroad station, a relatively large proportion of young and single households with lower income and foreigners28,29, a large difference between the daytime and the nighttime population, and the number of criminal offenses recognized was relatively high among Tokyo regions, with improving security being an issue. The old town (Code 121) is a mixed commercial, industrial and residential zone with a shrinking and aging population. Therefore, not only younger, but also older men were probably affected by the pandemic. A large social disparity28 including income inequality30 were also issues. Further, for males, the number of detection areas decreased in 2020 and 2021, but for females, Shinjuku (Code 104) was detected by both methods. However, in our analysis, only temporality was considered in terms of years only. Due their regional specificity, further study is warranted. World-wide, several social factors have been addressed in suicide prevention, but those are varied according to sociocultural conditions and effective interventions within a certain population. To obtain useful information, spatial epidemiology in one’s own country is useful. In this study, we concentrated on detecting high-risk districts within Tokyo for suicide deaths. Only sociocultural factors were included in the analyses. However, the attributed factors were relatively stable during this period by factor analysis (results not shown). Therefore, the results of the CAR models using covariates provided certain pertinent information. There were studies in Japan5,31 as well as in other countries8-11 that socioeconomic deprivation was associated with high-risk suicide clusters detected. In our study, notwithstanding these differences, findings that detected high-risk suicide clusters were associated with socioeconomic deprivation during pre-pandemic, not after the pandemic. After the pandemic, as Spittal32 mentioned, increased suicides in Japan among employed people, adult women have been identified. To address these issues, a detailed social epidemiological analysis is warranted.
Strengths, limitations, and future research
To use novel spatial clustering techniques to provide ecological information on suicide risk. We applied several clustering methods that consider spatial correlation and spatial smoothing methods because, these methods stand on special assumptions. Thus far, the studies that consider geographical correlations in suicide research have been conducted in Japan25 and in other countries8-10. The results provide insights into the potential for direct interventions in high-risk areas. Regarding the limitations of our study, first, our data on socio-economic and environmental factors were limited to a single point in the census year (2011). However, these factors identified a similar association between 2011 and 2015 in the regions by factor analyses using the available census data. Therefore, the effects of the covariates potentially do not largely affect the spatial correlation in the regions of Tokyo, and thus the probable bias is not large. Second, our analysis used the data from national agency sources, the most reliable sources at present. They provided the summarized data by region in each prefecture, and we treated unknown as missing. In our data, those who die by suicide cannot report on the actual reasoning behind their act and we excluded the data with age and/or sex unknown. However, the number was few. Effective suicide prevention should be an important public health consideration, particularly among vulnerable populations. This study also highlighted the characteristics of the trajectory changes in suicide mortality before and after COVID-19 not only yearly trend, but also regional variation and trend, which were examined by considering spatial smoothing. Namely, the primary objective of this study was spatial clustering of suicide mortality in Tokyo using data from regional statistics on male and female suicide deaths from 2011 to 2021, before and after the onset of the COVID-19 pandemic and the second objective was to examine the impacts of COVID-19. The first objective was met, but not the second. As COVID-19 was excluded from the analyses, in the sense that only temporality is considered in terms of years only. The impact of COVID-19 was mainly the interpretation of the socio-economic regional characteristics. Other factors that might contribute to an increased suicide rate were not adequately addressed. For example, mental stress, loneliness, stress and social separation resulting from lockdown increased mental health problems and suicide risk during COVID-19. These factors that might vary according to jurisdictions with a level of lockdown will also rationalize why the analysis of regional trends of suicide rate is important.
This study clarified the longitudinal suicide mortality trajectories at the regional level in Tokyo. The strategy for this purpose, we used several analyses for estimating suicide risk by CAR models (with / without covariates), and testing for spatial clustering. Spatial accumulation is tested under the assumptions of each model and the results change according to the assumption. Consider such properties, it is worthwhile to consider in several ways and notwithstanding several assumptions, a few regions were detected.
Our study provides some important information for a better understanding of where to target resources and expend preventive efforts to reduce the burden of suicide in high-risk regions not only in Japan but also in global health. Because of their regional specificity, further study is warranted. Further, this study on region-level suicide mortality in Tokyo and its potential to inspire future studies for greater suicide risk prevention.
Conclusions
During the COVID-19 pandemic in 2020 and 2021, males and females in their 20s as well as males in their 50s showed a tendency toward an increase in suicides. The result of the spatial scan statistics showed evidence of hotspots of suicide mortality across regions of Tokyo. To proceed with regional health policy making, spatial epidemiology is one of the useful tools.
Appendix
Indices for standardized mortality
Standardization was conducted by the year based on each year’s sum from 2011 to 2020. The detail formula was shown in the below.
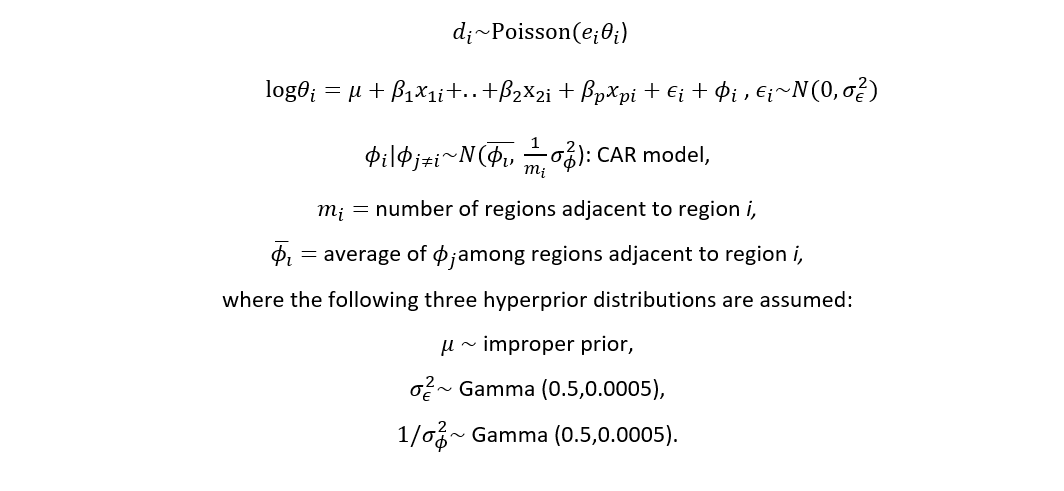
Let di indicates the observed number of deaths of disease under study in the region i (=1,…, M) and ei indicates the expected number of deaths calculated based on the number of suicides per age group in the reference population (Tokyo) in each year and the age distribution of the population of region i. Further, let θi denotes the relative risk of the disease under study in the region i. Then, under the assumption that the observed number of deaths di follows a Poisson distribution with the expected number of deaths eiθi , the maximum likelihood estimator of θi is so-called standardized mortality ratio (SMR):
SMRi = di / ei
SMRs are frequently used as disease maps. However, SMRs have an undesirable property that they can be largely affected by the difference in population size. Therefore, the empirical Bayes estimator (EBSMR) are used for the relative risk θi as follows. Let us assume that θi (i =1,…, M) is independently distributed with a prior gamma distribution with parameter η = (α, β),
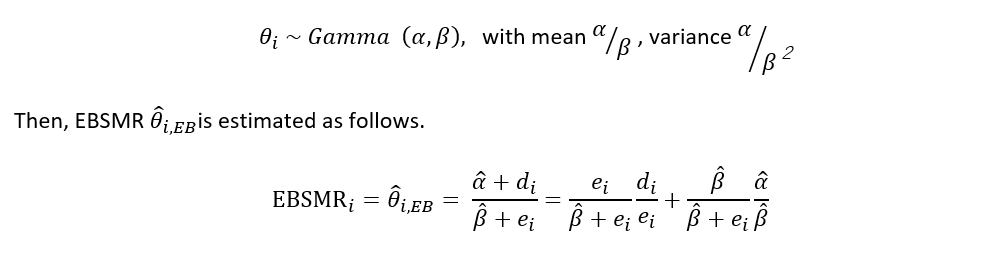
where (α, β) denote the marginal maximum likelihood estimator17.
Acknowledgment
This study was predominantly funded by JSPS KAKENHI Grant Number JP19K21569.
Conflicts of interest
The authors declare that they have no competing interests.
References
- Ministry of Health, Labour and Welfare. Changes in the number of suicides based on the National Police Agency's suicide statistics, etc. (in Japanese) https://www.mhlw.go.jp/ stf/seisakunitsuite/bunya/hukushi_kaigo/seikatsuhogo/jisatsu/jisatsu_year.html. Accessed January 26, 2022.
- World Health Organization. Mental health action plan 2013 - 2020. WHO. 2013. pp48. ISBN: 978 92 4 150602. https://www.who.int/mental_health/publications/action_plan/en/. Accessed January 26, 2022.
- World Health Organization. National suicide prevention strategies: progress, examples and indicators. WHO. 30 Nov, 2018. ISBN 978-92-4-151501-6. https://www.who.int/health-topics/suicide#tab=overview. Accessed January 26, 2022.
- Ministry of Health, Labour and Welfare. 2021 Suicide Countermeasures White Paper. (in Japanese) https://www.mhlw.go.jp/stf/seisakunitsuite/bunya/hukushi_kaigo/seikatsuhogo/jisatsu/jisatsuhakusyo2021.html. Accessed January 26, 2022.
- Yamaoka K, Suzuki M, Inoue M, et al. Spatial clustering of suicide mortality and associated community characteristics in Kanagawa prefecture, Japan, 2011-2017. BMC Psychiatry. 2020; 20: 74. https://doi.org/10.1186/s12888-020-2479-7
- Tanaka T, Okamoto S. Increase in suicide following an initial decline during the COVID-19 pandemic in Japan.Nat Hum Behav. 2021; 5: 229-238. https://doi.org/10.1038/s41562-020-01042-z
- Elliott P, Wartenberg D. Spatial Epidemiology: Current Approaches and Future Challenges. Environ Health Perspect. 2004; 112: 998-1006.
- Torok M, Konings P, Batterham PJ, et al. Spatial clustering of fatal, and non-fatal, suicide in new South Wales, Australia: implications for evidence-based prevention. BMC Psychiatry. 2017; 17: 339.
- Santos ADD, Guimarães LML, Carvalho YF, et al. Spatial analysis and temporal trends of suicide mortality in Sergipe, Brazil, 2000-2015. Trends Psychiatry Psychother. 2018; 40: 269-266.
- Kassem AM, Carter KK, Johnson CJ, et al. Spatial Clustering of Suicide and Associated Community Characteristics, Idaho, 2010–2014. Prev Chronic Dis. 2019; 16: 180429.
- Naghave M. Global, regional, and national burden of suicide mortality 1990 to 2016: systematic analysis for the Global Burden of Disease Study 2016. BMJ.2019; 364: l94.
- Tango T. Statistical methods for disease clustering. 2010.
- Lawson AB. Statistical methods in spatial epidemiology. 2nd ed. John Wiley & Sons Ltd. 2006.
- e-Stat is a portal site for Japanese Government Statistics. View Data | Municipality data | System of Social and Demographic Statistics (SSDS) | Search by areas | Portal Site of Official Statistics of Japan (e-stat.go.jp). Accessed February 26, 2022.
- Besag J, Newell J. The detection of clusters in rare diseases. Journal of the Royal Statistical Society, Series A. 1991; 154: 143-55.
- Lunn D, Spiegelhalter DJ, Thomas A, et al. The BUGS Project: Evolution, Critique and Future Directions. Statist Med. 2009; 28: 3049-67.
- Tango T, Takahashi K. A flexibly shaped spatial scan statistic for detecting clusters. International Journal of Health Geographics. 2005; 4: 11.
- Kulldorff M, Nagarwalla N. Spatial disease clusters: detection and inference. Statist Med. 1995; 14: 799-810.
- Kulldorff M. Information Management Services, Inc. SaTScan v8.0: Software for the spatial and space-time scan statistics. 2009. Accessed June 10, 2018.
- Tango T. A class of tests for detecting ‘general’ and ‘focused’ clustering of rare diseases. Statist Med. 1995; 14: 2323-34.
- Kubo T. Divided Tokyo: Disparities in Living Conditions in the City Center and the Shrinking Suburbs. 2020 Springer Singapore, ISBN: 978-981-15-4202-2. https://doi.org/10.1007/978-981-15-4202-2
- Sakamoto H, Ishikane M, Ghaznavi G, et al. Assessment of Suicide in Japan During the COVID-19 Pandemic vs Previous Years. JAMA Network Open. 2021; 4(2): e2037378. doi:10.1001/jamanetworkopen.2020.37378
- Horita N, Morigucchi MS. Trends in Suicide in Japan Following the 2019 Coronavirus Pandemic. JAMA Network Open. 2022; 5(3): e224739. doi:10.1001/jamanetworkopen.2022.473
- Koda M, Harada N, Eguchi A, et al. Reasons for suicide during the COVID-19 pandemic in Japan. JAMA Network Open. 2022; 5(1): e2145870. doi:10.1001/jamanetworkopen.2021.45870
- Nomura S, Kawashima T, Yoneoka D, et al. Trends in suicide in Japan by gender during the COVID-19 pandemic, up to September 2020. Psychiatry Res. 2021; 295: 113622.
- Yoshioka E, Hanley SJB, Sato Y, et al. Impact of the COVID-19 pandemic on suicide rates in Japan through December 2021: An interrupted time series analysis. Lancet Reg Health-West Pac. 2022; 24: 100480
- Bureau of Social Welfare and Public Health. The welfare statistical annual report 2020: Welfare benefits. https://www.fukushihoken.metro.tokyo.lg.jp/kiban/chosa_tokei/nenpou/2020.html. Accessed February 21, 2022.
- Hashimoto K. Expanding disparity and polarization of Metropolitan areas after 1980s: Time-lagged gentrification as a ‘Bloodless Revolution’. The annals of Japan Association for Urban Sociology. 2017; 35: 23-44. (In Japanese)
- Hashimoto K. Tokyo 23-KU × KAKUSA TO KAIKYU (“Expanding Tokyo 23 Ward” × “gap and class”). Chuko Shinsyo RAKURE. 2021: 741: 334. (In Japanese)
- Tibber MS, Walji F, Kirkbride JB, et al. The association between income inequality and adult mental health at the subnational level—a systematic review. Soc Psychiatry Psychiatr Epidemiol. 2022; 57: 1-24. https://doi.org/10.1007/s00127-021-02159-w
- Yoshioka E, Hanley SJB, Sato Y, et al. Geography of suicide in Japan: spatial pattering and rural-urban differences. Social Psychiatry and Psychiatric Epidemiology. 2021; 56: 731-746.
- Spittal MJ. COVID-19 and suicide: Evidence from Japan. The Lancet Regional Health. 2022; 27: 100578. https://doi.org/10.1016/j.lanwpc.2022.100578
Supplementary Files
Supplementary File 1: Characteristics of variables in 54 regions in Tokyo.
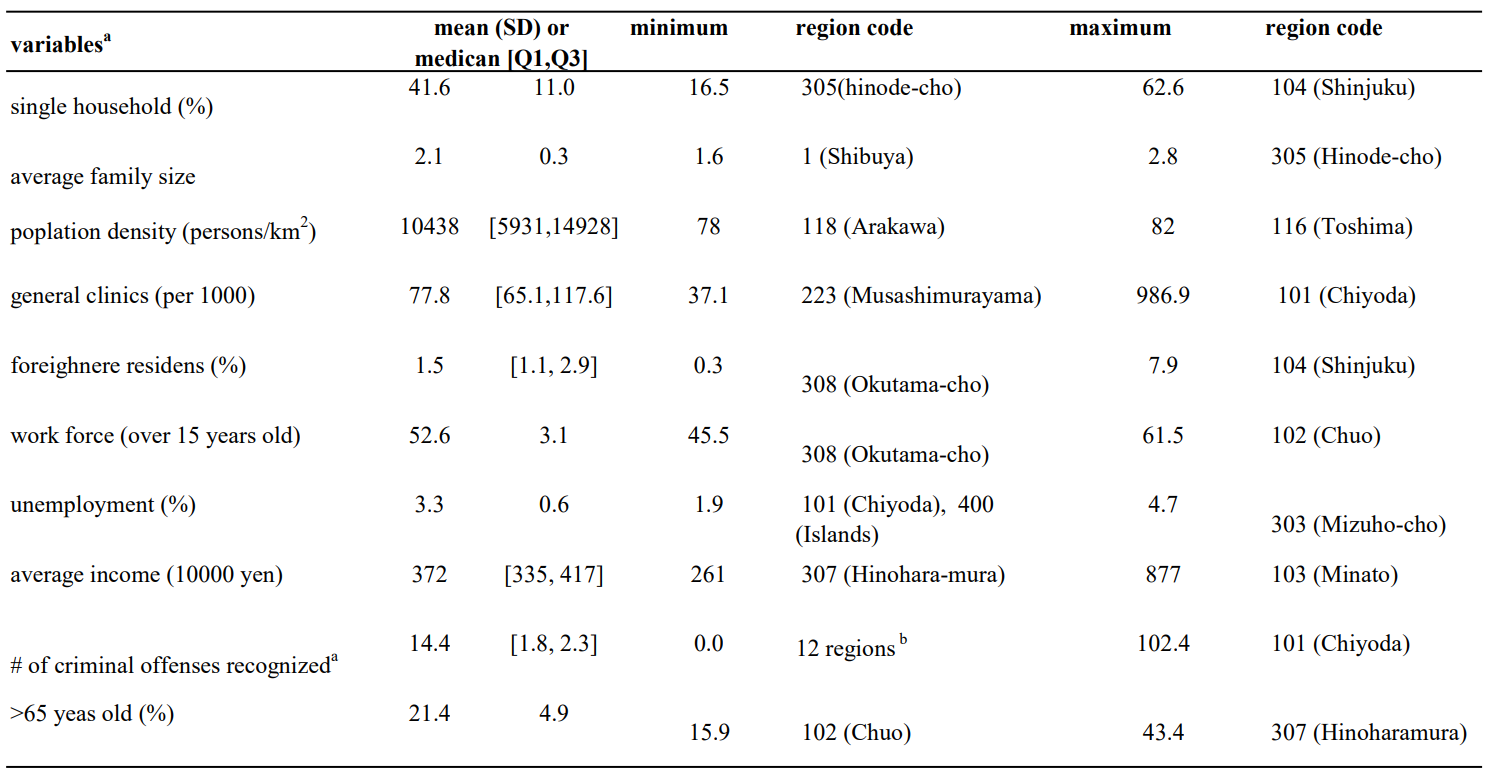
a. Variables were from census data in 2011.
b. 214, 215, 219, 221, 222, 223, 225, 227, 303, 305, 307, 308.
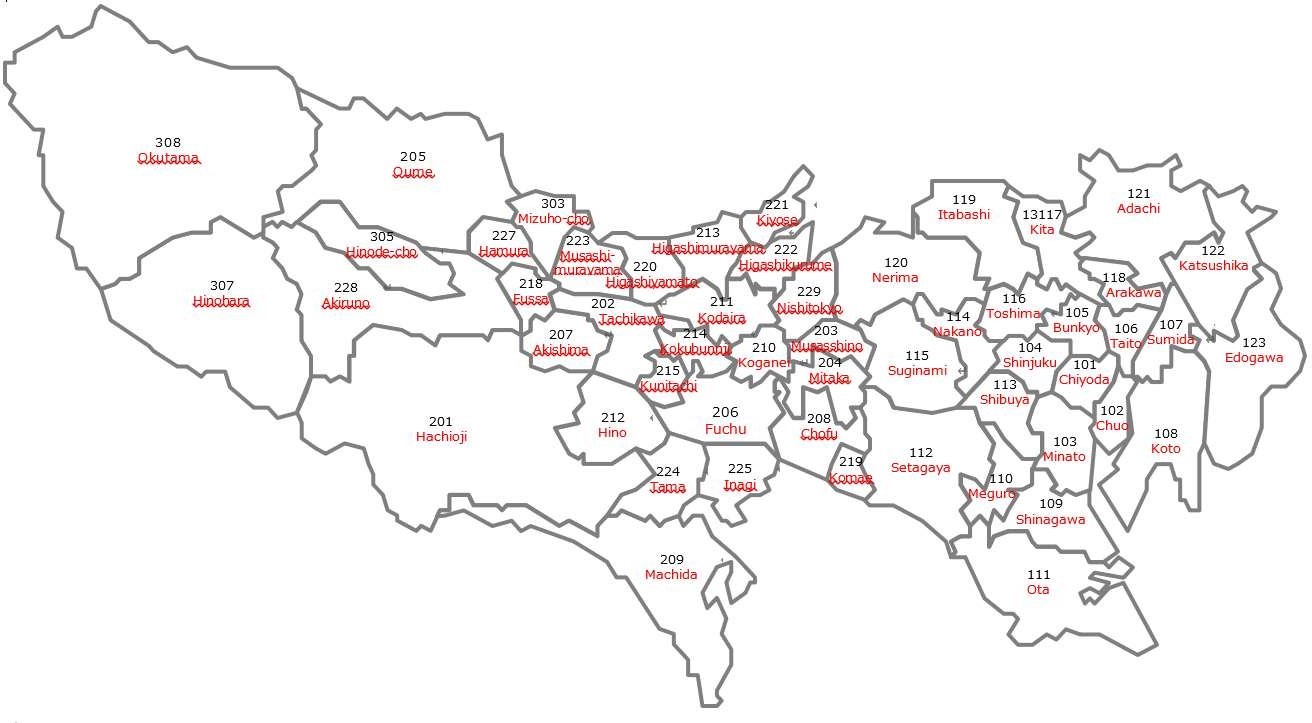
Supplementary File 2: Map with region code
Supplementary File 3: Related factors analysed by multivariable model using the CAR model (analysed using OpenBUGS).
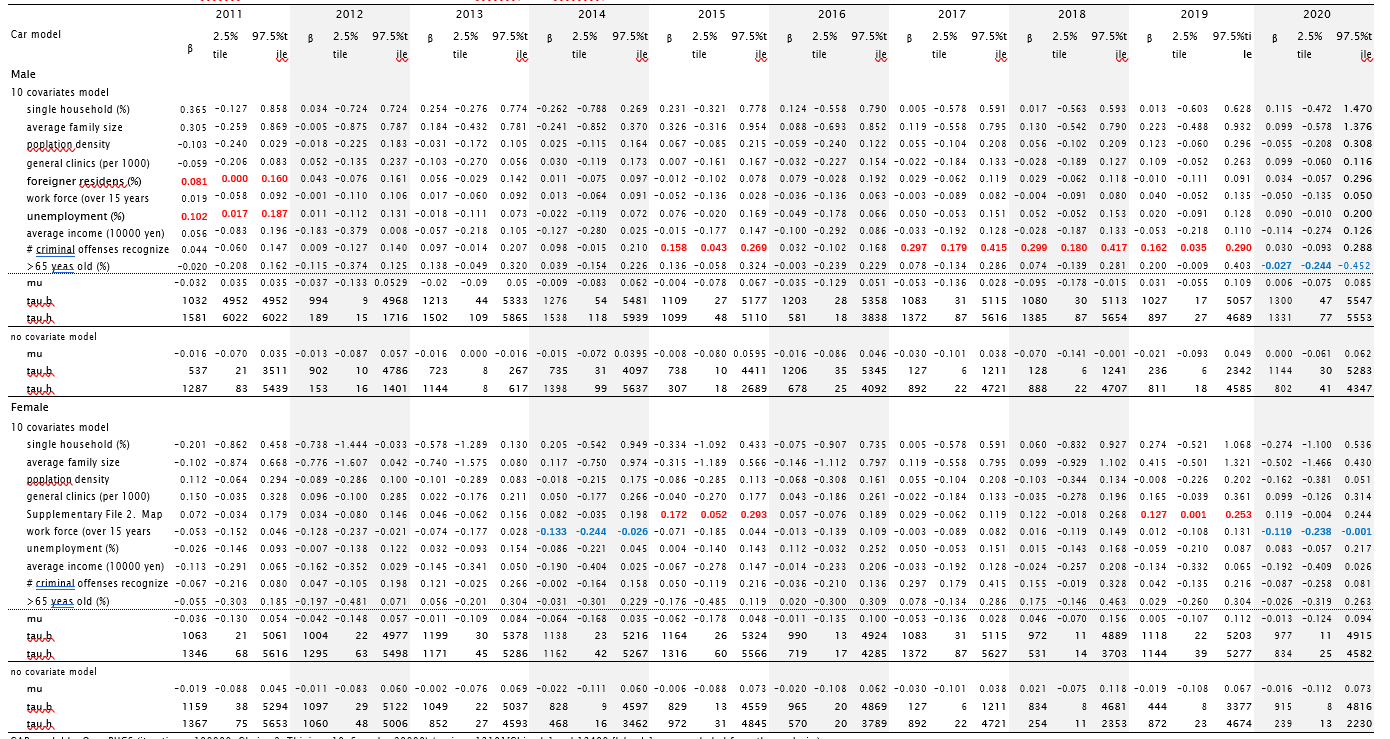
CAR model by OpenBUGS (iterations=100000, Chain=2, Thining=10, Sample=20000) (regions 13101[Chiyoda] and 13400 [Islands] were excluded from the analysis.) β: parameter estimates,
SE: standard error,
β: parameter estimates; SE: standard error; all covariates were used after centroided (mean 0, variance 1).
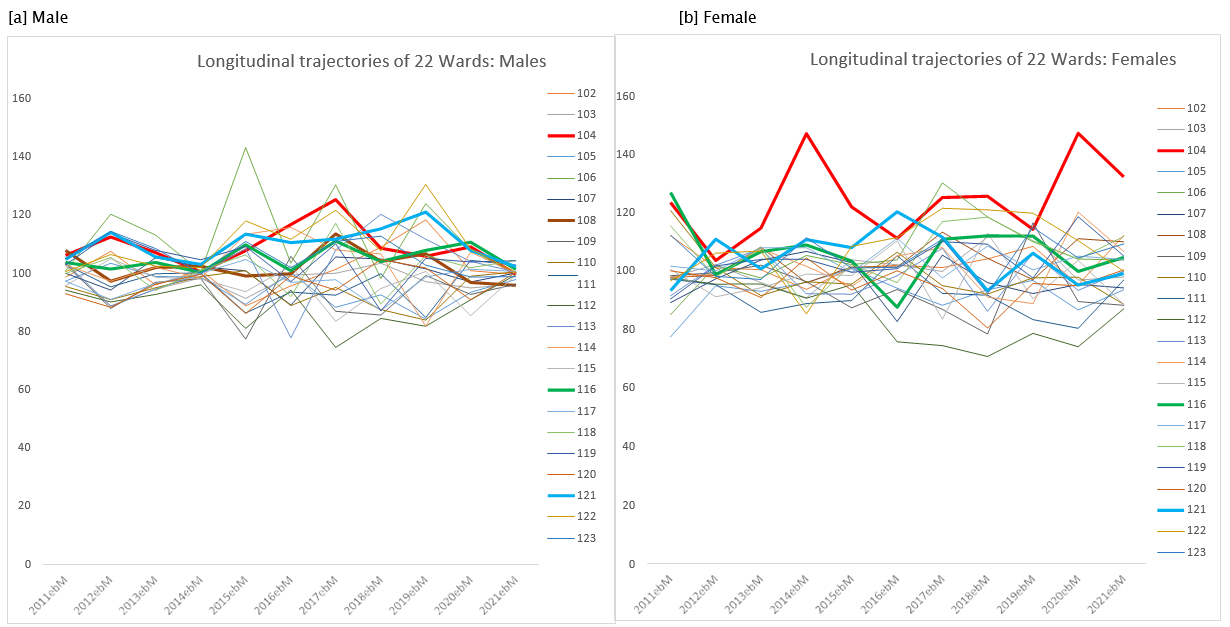
Supplementary File 4:Longitudinal trajectory of suicide death (EBSMR) according by 22 Wardsa in Tokyo: 2011 to 2021. ([a] Male, [b] Female)
a. Chiyoda-ward (Code 101) was an area that includes the Imperial Palace and has been excluded due to its peculiarity.