
Exposure to Adverse Life Events among Children Transitioning into Adolescence: Intersections of Socioeconomic Position and Race
Shervin Assari1,2,3*, Babak Najand4, Alexandra Donovan1
1Department of Internal Medicine, Charles R Drew University of Medicine and Science, Los Angeles, CA, USA
2Department of Family Medicine, Charles R Drew University of Medicine and Science, Los Angeles, CA, USA
3Department of Urban Public Health, Charles R Drew University of Medicine and Science, Los Angeles, CA, USA
4Marginalization related Diminished Returns Center, Los Angeles, CA, USA
Abstract
Background: Racism is shown to diminish the protective effects of family socioeconomic position (SEP) resources for racial minorities compared to the majority groups, a pattern called minorities’ diminished returns. Our existing knowledge is minimal about diminished returns of family SEP indicators on reducing exposure to adverse life events among children transitioning into adolescence. Aim: To compare diverse racial groups for the effects of family income and family structure on exposure to adverse life events of pre-adolescents transitioning to adolescence.
Methods: In this longitudinal study, we analyzed data from 22,538 observations belonging to racially diverse groups of American 9–10-year-old children (n = 11,878) who were followed while transitioning to adolescence. The independent variables were family income and family structure. The primary outcome was the number of stressful life events with impact on adolescents, measured by the Life History semi-structured interview. Mixed-effects regression models were used for data analysis to adjust for data nested to individuals, families, and centers.
Results: Family income and married family structure had an overall inverse association with children’s exposure to adverse life events during transition to adolescence. However, race showed significant interactions with family income and family structure on exposure to adverse life events. The protective effects of family income and married family structure were weaker for African American than White adolescents. The protective effect of family income was also weaker for mixed/other race than White adolescents.
Conclusion: While family SEP is protective against children’s exposure to adverse life events, this effect is weaker for African American and mixed/other race compared to White youth.
Introduction
Adverse life experiences are a major social determinant of children’s health and development1. Children who experience adverse life events during the transition to adolescence have worse developmental outcomes in adulthood. The harmful effects of adverse life experiences are non-specific and systemic, impacting a wide range of physiological pathways2,3 and contributing to general anxiety4, post-traumatic stress5, depressive disorder4, suicidality3, substance use6, drug use7, and premature mortality3,8. Exposure to adverse life experiences during the transition to adolescence negatively impacts brain and neurocognitive development9, and increases the risk of cardiovascular and metabolic diseases10. Potential mechanisms responsible for the negative health effects of adverse life experiences include systemic inflammation11, telomere shortening12,13, and altered DNA methylation14,15.
Racial minority status16 and low socioeconomic position (SEP)17 are two overlapping constructs that correlate with higher exposure to adverse life experiences during childhood and adolescence18. Racial minority and low SEP families report higher levels of exposure to adverse life experiences, impacting child and adolescent health and development19. Differences in exposure to adverse life experiences may be one of the main underlying mechanisms that explain racial- and SEP-related disparities in health and development18. Evidence suggests the impact of SEP on health at the population and individual level may be exerted through increased exposure to adverse life experiences20.
Recent studies using cross-sectional data show a stronger SEP-associated reduction in exposure to adverse life experiences among White children, youth, and adults compared to racial minorities21-24. Using the Adolescent Brain Cognitive Development (ABCD) study data, researchers showed SEP effects on exposure to adverse life experiences were weaker for African American children than White children25. The cross-sectional study compared the role of parental education and family income but did not include the role of family structure or examine other racial groups25. Another cross-sectional study used data from the Fragile Families and Child Wellbeing Study (FFCWS) and found an inverse link between SEP and spanking that was weaker in African American than White children26. High SEP African American parents report higher levels of occupational stress than their lower SEP counterparts, while high SEP White parents report lowered occupational stress compared to lower SEP White parents27. In a cross-sectional survey study, high SEP African Americans remained at higher risk of poverty than high SEP Whites28,29. Thus, high SEP is associated with a stronger reduction in parental stress, adverse life experiences, and risk of poverty among White families compared to African American families. This research is mainly cross-sectional, and future research using longitudinal data is needed to better understand the interaction between SEP and adverse life experiences.
African American and Latino youth and adults show diminished protective effects of certain family SEP indicators such as family income and family structure on tangible health and developmental outcomes30,31. According to Marginalization-related Diminished Returns (MDRs) theory, various SEP indicators29,32-34 tend to generate smaller health gains for racialized and minoritized groups31,34-38. However, most of the MDRs literature is on African American families30,31,36,39,40, and further research is needed to compare the effects of family SEP on exposure to adverse life experiences between Whites and other various racial groups.
Aims
Our aim was to compare the effects of family income and family structure on children’s exposure to adverse life experiences during their transition to adolescence and determine whether the size of effect varied according to minority status. We expected weaker protective effects of family income and family structure among racial minorities compared to White children. Weaker protective effects of SEP may explain why high SEP racial minority youths remain at higher risk of depression, anxiety, and substance use compared to White youths (i.e., MDRs)30,31. We build on the previous research by incorporating a longitudinal design, expanding the comparison to include other non-White groups, and testing for diminished returns of two SEP indicators, namely family income and family structure, on children’s exposure to adverse life experiences during their transition to adolescence.
Methods
We conducted a secondary analysis of the Adolescent Brain Cognitive Development (ABCD) study data. ABCD is a national longitudinal investigation of a racially and economically diverse sample of pre-adolescent children transitioning to adolescence41. Recruitment was mainly from schools42, and more information about ABCD's purpose, methodology, and measurement is available elsewhere41. ABCD data is diverse across race, SEP, and geography. The analytical sample contained 22,538 observations belonging to 11,878 pre-adolescents. ABCD study ethics were originally approved by the University of California, San Diego (UCSD) Institutional Review Board (IRB). All adolescents who participated in the ABCD study provided assent, and all parents who participated in the ABCD project signed informed consent43. Our study was exempt from a full IRB review, as decided by the Charles R. Drew University of Medicine and Science IRB.
Our study variables included demographic factors: parental education, race, ethnicity, age and gender, and two SEP indicators: family income and family structure. Exposure to adverse life experiences was measured every two years and all other variables were measured at enrollment. Parents reported their child’s date of birth, and age was calculated in months (time interval between birth and study enrollment). Age was treated as a continuous measure, gender was a dichotomous variable, and ethnicity was 1 for Latino/Hispanic and 0 for non-Latino/non-Hispanic. Parents answered the questions "What is the highest grade or level of school you have completed or the highest degree you have received?" and "What is the highest grade or level of school your partner has completed or the highest degree he/she has received?" Responses were as listed in Table 1. Parental education variables reflected the highest education of mother or father. Family income was a categorical measure with three levels. The exact question was, "What is your total combined family income for the past 12 months? This should include income (before taxes and deductions) from all sources, wages, rent from properties, social security, disability and veteran's benefits, unemployment benefits, worker’s compensation". Responses were also as listed in Table 1. Parents reported their marital status, and family structure was dichotomously coded 1 for married (two-parents co-living) and 0 for any other status. Parent reported race of the child was the moderator. This variable was a categorical measure with the following categories: African American/Black, Asian, Mixed/Other, and White (reference category).
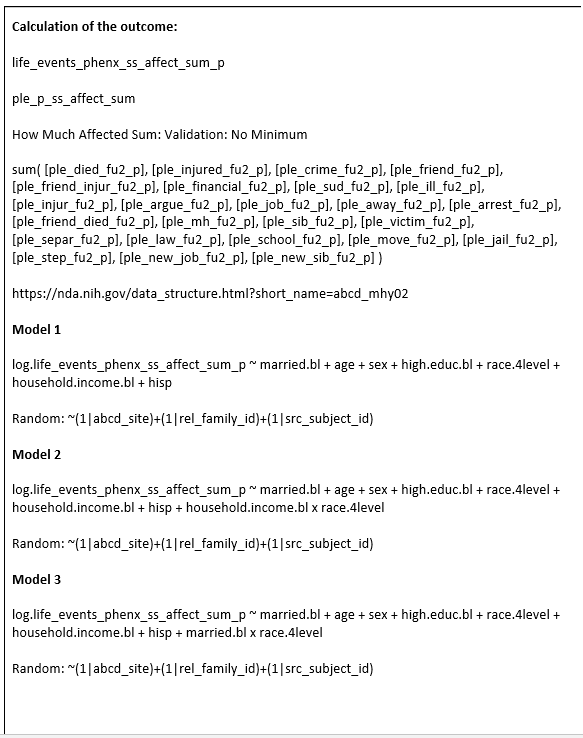
Adverse life experiences during transition to adolescence was measured using the Life events history, a validated instrument to measure traumatic events and adversities. Life events history is a semi-structured interview with items such as 1) Someone in family died? 2) Family member was seriously injured? 3) Saw crime or accident? 4) Lost a close friend? The response for each item was 0 (no) or 1 (yes). If an event was experienced, the following questions were asked: did the event happen during the last year? Was the event negative or positive? To what degree did the event effect the individual’s life (0 = Not at All; 1 = A Little; 2 = Some; 3 = A lot)? By counting the responses indicating a negative effect of an adverse life experience, we generated a continuous variable with higher scores indicating higher exposure to impactful adverse life experiences during the transition to adolescence44. Log of this continuous number was then calculated and used as the outcome measure. Appendix 1 shows the formula for calculation of the sum score.
The Data Exploration and Analysis Portal (DEAP) statistical platform, based on the R statistical package, was used for analysis. For univariate analysis, we reported mean and standard deviation [SD] and frequency/percentage overall and by race. For multivariable analysis, mixed-effects regression models (a specific type of multi-level regression) were used. These models adjusted for ABCD nested data, as multiple observations exist per individuals, who are nested to families, who are themselves nested to centers. All regression models were performed in the pooled sample, including all racial groups regardless of their group membership. Model 1 did not include any interaction terms. Beta from this model is indicative of the association between independent and dependent variables in the pooled sample. Models 2 and 3 included interaction terms between race and family income and family structure, respectively. Betas from these models are indicative of the association in Whites (main effect) and difference between other races and Whites (interaction term). The outcome was the effect of adverse life experiences during the transition to adolescence. Predictors were family income and structure. The moderator was race. Confounders were age, gender, ethnicity, and parental education. Before we tested the models, we ruled out collinearity between our measures. Family income, family structure, and parental education were operationalized as categorical variables and there was no collinearity between our study variables (all correlations weaker than .4). Standardized beta coefficients (b), 95% CI, and p-value were reported.
Results
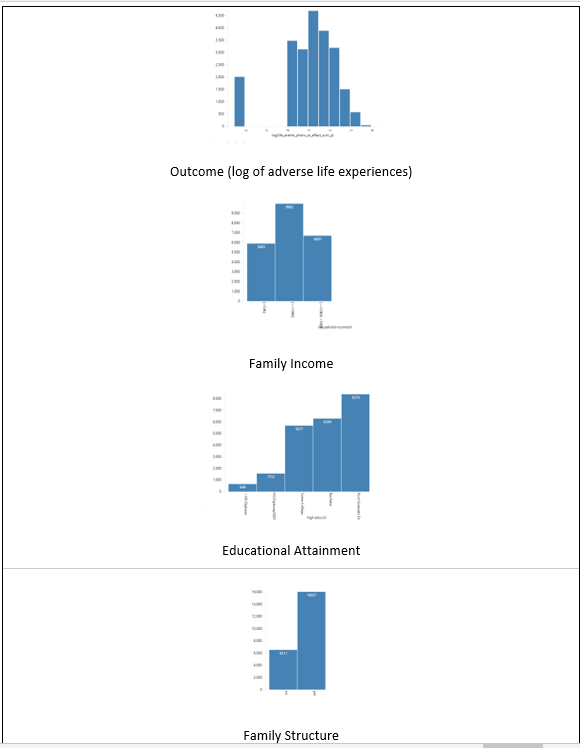
Table 1 provides a summary of descriptive statistics for both the overall sample and split by race. Our secondary analysis was performed on 22,538 nested observations that belonged to 11,023 9-10 years old children followed over time. On average, each participant had two observations and the total number of observations by race were White (n = 15,546; 69.0%), African American (n = 2,872; 12.7%), Asian (n = 424; 1.9%), and other/mixed race (n = 3,696; 16.4%). Racial groups differed in age, gender, family education, income, structure, and exposure to impactful adverse experiences during the transition to adolescence.
Table 1: Descriptive data overall and by race.
|
Vars |
Level |
Overall |
White |
African American |
Asian |
Other/Mixed |
P |
|
N |
22,538 |
15,546 |
2,872 |
424 |
3,696 |
|
|
|
|
|
Mean (SD) |
Mean (SD) |
Mean (SD) |
Mean (SD) |
Mean (SD) |
|
|
Age (Month) * |
|
141.18 (12.01) |
141.48 (12.09) |
140.08 (11.41) |
141.45 (12.27) |
140.72 (12.06) |
< 0.001 |
|
Log (Adverse Experiences)* |
1.07 (1.34) |
1.08 (1.31) |
0.97 (1.44) |
0.56 (1.37) |
1.16 (1.35) |
< 0.001 |
|
|
|
|
n(%) |
n(%) |
n(%) |
n(%) |
n(%) |
|
|
Family Structure (Married)* |
No |
6511 (28.9) |
3121 (20.1) |
1961 (68.3) |
66 (15.6) |
1363 (36.9) |
< 0.001 |
|
|
Yes |
16027 (71.1) |
12425 (79.9) |
911 (31.7) |
358 (84.4) |
2333 (63.1) |
|
|
Gender* |
Female |
10731 (47.6) |
7273 (46.8) |
1425 (49.6) |
205 (48.3) |
1828 (49.5) |
0.003 |
|
|
Male |
11807 (52.4) |
8273 (53.2) |
1447 (50.4) |
219 (51.7) |
1868 (50.5) |
|
|
Parental Education* |
< HS Diploma |
649 (2.9) |
256 (1.6) |
194 (6.8) |
7 (1.7) |
192 (5.2) |
< 0.001 |
|
|
HS Diploma/GED |
1552 (6.9) |
632 (4.1) |
564 (19.6) |
3 (0.7) |
353 (9.6) |
|
|
|
Some College |
5677 (25.2) |
3247 (20.9) |
1159 (40.4) |
34 (8.0) |
1237 (33.5) |
|
|
|
Bachelor |
6284 (27.9) |
4804 (30.9) |
483 (16.8) |
111 (26.2) |
886 (24.0) |
|
|
|
Post Graduate Degree |
8376 (37.2) |
6607 (42.5) |
472 (16.4) |
269 (63.4) |
1028 (27.8) |
|
|
Family Income * |
< 50K |
5885 (26.1) |
2639 (17.0) |
1804 (62.8) |
60 (14.2) |
1382 (37.4) |
< 0.001 |
|
|
> =50K& < 100K |
6691 (29.7) |
4872 (31.3) |
680 (23.7) |
96 (22.6) |
1043 (28.2) |
|
|
|
> =100K |
9962 (44.2) |
8035 (51.7) |
388 (13.5) |
268 (63.2) |
1271 (34.4) |
|
|
Ethnicity |
Non- Hispanic |
18564 (82.4) |
13151 (84.6) |
2731 (95.1) |
385 (90.8) |
2297 (62.1) |
< 0.001 |
|
|
Hispanic |
3974 (17.6) |
2395 (15.4) |
141 (4.9) |
39 (9.2) |
1399 (37.9) |
|
*p < 0.05 for comparison of racial groups
Multivariate Analysis
Table 2 shows the model fits. Model 3 with family structure by race interactions showed the best fit, followed by Model 1 with main effects only. Model 2 with family income by race interactions showed the worst fit.
Table 2: Fit across models.
|
|
Model 1 |
Model 2 |
Model 3 |
|
N |
22,538 |
22,538 |
22,538 |
|
R-squared |
0.02276 |
0.02331 |
0.02324 |
|
ΔR-squared |
0.0083 |
0.00767 |
0.01191 |
|
ΔR-squared % |
0.83% |
0.77% |
1.19% |
Model 1: Main Effects of SEP Indicators + Covariates
Model 2: Main Effects of SEP Indicators + Covariates + Race x Family Income
Model 3: Main Effects of SEP Indicators + Covariates + Race x Family Structure
Table 3 summarizes the results of two regression models in the overall (pooled) sample. Model 1 (Main Effect Model) showed inverse associations between family income and exposure to adverse life experiences during transition to adolescence. Model 2 showed that the association between family income and exposure to adverse life experiences varies by race. The protective effect of high family income on children’s exposure to adverse life experiences was weaker for African American and mixed/other race than White children (Appendix Figure 1 and Appendix Figure 2).
Table 3: Summary of regression in the absence and presence of interactions between race and family income.
|
Estimate |
Std. Error |
p |
Estimate |
Std. Error |
p |
|
|
|
|
Model 1 |
|
|
Model 2 |
|
|
Family Structure (Married) |
-0.44 |
0.03 |
< 0.001 |
-0.45 |
0.03 |
< 0.001 |
|
Age (Month) |
0.00 |
0.00 |
0.012 |
0.00 |
0.00 |
0.013 |
|
Gender (Male) |
-0.08 |
0.02 |
< 0.001 |
-0.08 |
0.02 |
0.000 |
|
Ethnicity (Hispanic) |
-0.20 |
0.04 |
< 0.001 |
-0.21 |
0.04 |
< 0.001 |
|
Race |
|
|
|
|
|
|
|
White |
|
|
|
Reference |
|
|
|
African American |
-0.33 |
0.04 |
< 0.001 |
-0.41 |
0.06 |
< 0.001 |
|
Asian |
-0.52 |
0.08 |
< 0.001 |
-0.44 |
0.22 |
0.048 |
|
Other/Mixed |
0.02 |
0.03 |
0.586 |
-0.08 |
0.06 |
0.173 |
|
Parental Education |
|
|
|
|
|
|
|
Less than HS Diploma |
Reference |
|
|
Reference |
|
|
|
HS Diploma/GED |
0.24 |
0.08 |
0.003 |
0.24 |
0.08 |
0.003 |
|
Some College |
0.56 |
0.07 |
< 0.001 |
0.55 |
0.07 |
< 0.001 |
|
Bachelor |
0.56 |
0.08 |
< 0.001 |
0.54 |
0.08 |
< 0.001 |
|
Post Graduate Degree |
0.58 |
0.08 |
< 0.001 |
0.57 |
0.08 |
< 0.001 |
|
Family Income |
|
|
|
|
|
|
|
< 50K |
Reference |
|
|
Reference |
|
|
|
> =50K& < 100K |
-0.08 |
0.04 |
0.046 |
-0.11 |
0.05 |
0.018 |
|
> =100K |
-0.32 |
0.04 |
< 0.001 |
-0.38 |
0.05 |
< 0.001 |
|
Family Income > =100K x African American |
|
|
|
0.30 |
0.11 |
0.006 |
|
Family Income > =50K& < 100K x African American |
|
|
|
0.04 |
0.09 |
0.687 |
|
Family Income > =100K x Asian |
|
|
|
-0.02 |
0.24 |
0.944 |
|
Family Income > =50K& < 100K x Asian |
|
|
|
-0.28 |
0.28 |
0.325 |
|
Family Income > =100K x Other/Mixed |
|
|
|
0.18 |
0.08 |
0.025 |
|
Family Income > =50K& < 100K x Other/Mixed |
|
|
|
0.10 |
0.08 |
0.248 |
Table 4 summarizes the results of a regression model in the overall (pooled) sample. Model 1 (Main Effect Model) showed an inverse association between married family structure and exposure to adverse life experiences during transition to adolescence. Model 3 showed that the association between family structure and exposure to adverse life experiences among children during their transition to adolescence varies by race. The protective effect of a married family structure on children’s exposure to adverse life experiences was weaker for African American than White children (Appendix Figure 1 and Appendix Figure 2).
Table 4: Summary of regression in the absence and presence of interactions between race and family structure.
|
Estimate |
Std. Error |
p |
Estimate |
Std. Error |
p |
|
|
|
|
Model 1 |
|
|
Model 2 |
|
|
Family Structure (Married) |
-0.44 |
0.03 |
< 0.001 |
-0.51 |
0.04 |
< 0.001 |
|
Age (Month) |
0.00 |
0.00 |
0.012 |
0.00 |
0.00 |
0.014 |
|
Gender (Male) |
-0.08 |
0.02 |
< 0.001 |
-0.08 |
0.02 |
0.000 |
|
Ethnicity (Hispanic) |
-0.20 |
0.04 |
< 0.001 |
-0.21 |
0.04 |
< 0.001 |
|
Race |
|
|
|
|
|
|
|
White |
Reference |
|
|
Reference |
|
|
|
African American |
-0.33 |
0.04 |
< 0.001 |
-0.44 |
0.05 |
< 0.001 |
|
Asian |
-0.52 |
0.08 |
< 0.001 |
-0.45 |
0.22 |
0.035 |
|
Other/Mixed |
0.02 |
0.03 |
0.586 |
-0.07 |
0.06 |
0.263 |
|
Parental Education |
|
|
|
|
|
|
|
Less than HS Diploma |
Reference |
|
|
Reference |
|
|
|
HS Diploma/GED |
0.24 |
0.08 |
0.003 |
0.24 |
0.08 |
0.003 |
|
Some College |
0.56 |
0.07 |
< 0.001 |
0.55 |
0.07 |
< 0.001 |
|
Bachelor |
0.56 |
0.08 |
< 0.001 |
0.54 |
0.08 |
< 0.001 |
|
Post Graduate Degree |
0.58 |
0.08 |
< 0.001 |
0.57 |
0.08 |
< 0.001 |
|
Family Income |
|
|
|
|
|
|
|
< 50K |
Reference |
|
|
Reference |
|
|
|
> =50K& < 100K |
-0.08 |
0.04 |
0.046 |
-0.32 |
0.04 |
< 0.001 |
|
> =100K |
-0.32 |
0.04 |
< 0.001 |
-0.08 |
0.04 |
0.029 |
|
Family Structure (Married) x African American |
|
|
|
0.25 |
0.08 |
0.002 |
|
Family Structure (Married) x Asian |
|
|
|
-0.07 |
0.23 |
0.765 |
|
Family Structure (Married) x Other/Mixed |
|
|
|
0.12 |
0.07 |
0.093 |
Discussion
Although family income and married family structure protected children against exposure to adverse life experiences during transition to adolescence, these effects were weaker for African American than White adolescents. Similarly, the effect of married family structure on children against exposure to adverse life experiences was weaker for other/mixed race than White children.
Our finding is a replication of our previous cross-sectional comparison between African American and White children, expanded to include longitudinal data and compare across all races. Our findings indicated diminished returns of family income and structure on future exposure to adverse life experiences during transition to adolescence for African American adolescents relative to Whites. In other words, high SEP better translates to less exposure to adverse life experiences during adolescence for White than African American or other/mixed race families. Thus, White children from married high-income families report fewer adverse life experiences during the transition to adolescence than African American children from married high income families.
These results replicate and extend other MDRs findings. Similar MDRs are documented for various SEP resources, age groups, and outcomes30,31. The literature has frequently documented MDRs for SEP indicators such as family income and family structure32,35,45,46. This paper suggests that higher-than-expected and disproportionate exposure to adverse life experiences during childhood and transition to adolescence may be one of the main explanatory mechanisms for higher rates of anxiety, depression, suicide, and health problems in racial minority children32,35,45,46 and adults23,24,47-49 across SEP levels. Thus, adverse life events contribute to the development of poor behavioral, physical, and mental health outcomes6,50,51.
While MDRs are well described, the societal and contextual processes that explain MDRs are still unknown. One potential explanation for our finding is segregation. African American families may remain in poor neighborhoods across SEP lines, with their children attending under resourced schools52,53. As a result of residing in this high-risk environment, environmental exposures are increased in high SEP African American families compared to high SEP Whites. In such a high-risk and low-resource social context, adolescents may be exposed to aggression from whom? peers? parents? neighborhood violence? and other stressors54,55.
Researchers have attributed MDRs to structural and institutional racism30,56. Childhood poverty may reduce the protective effect of high SEP attained as an adult57. Prejudice and discrimination also interfere with the expected benefits of increased family income and married family structure for minority families24,48,49. Multilevel economic and societal mechanisms may explain the persistence of MDRs across generations30,56.
There is an ongoing need for a more comprehensive body of research focused on understanding the multifaceted roles of peers, neighborhoods, schools, and family context in the continued risk present in high SEP African American adolescents. Studies are needed to ascertain the extent to which schools, neighborhoods, family environments, and peer interactions contribute to the enduring adverse life conditions experienced by high SEP African American adolescents. Additionally, there is a pressing need to investigate whether additional environmental exposures can amplify the effects of risk factors faced by adolescents in at-risk demographic groups. To address these critical research gaps, studies must delve into the interactions and relative contributions of these key factors in the lives of high SEP African American adolescents. By exploring the intricate connections between these environmental and social determinants, we can gain insights into the nuanced factors that influence the life trajectories and well-being of high SEP African American adolescents. Furthermore, such research can inform evidence-based strategies to provide targeted support and resources that address the unique challenges faced by this population, ultimately promoting greater equity and improved outcomes in their lives58. At the population level, researching the combined effects of economic and social determinants of health help to identify social or public policies that can equalize the returns of SEP indicators, and which strategies can best reduce the undesired effects of racial segregation in the lives of high SEP African American adolescents59.
Implications
Based on our findings, the following policies and directions can be suggested to reduce the impact of adverse life events on the lives of high SEP African American adolescents: First is to focus on reducing racism. Racism is a key factor that diminishes the returns of family SEP for racial minorities. Therefore, it is important to work towards reducing racism and discrimination against racial minority groups, particularly African Americans. Policy efforts should focus on promoting equity and inclusion in all aspects of life, particularly employment. Second is to strengthen the social support available for racial minority adolescents across SEP lines. Social support is an important factor in reducing stress and promoting mental health. Policies and programs should focus on increasing access to social support networks for high SEP racial minority adolescents. This can be achieved through programs that promote community involvement, peer mentoring, and family engagement. Third is to provide resources for coping with stress. Policies and programs may provide resources and support for coping with stress in African American communities, neighborhoods, and schools. This can include mental health services, stress management programs, and educational resources that improve adolescents’ coping strategies. Fourth is to improve access to counseling at schools. Policies should focus on improving access to free psychological services in urban areas with high concentration of African American families. Finally, we should educate parents and providers regarding high prevalence of stress in the lives of high SEP African American adolescents.
Limitations
This study had a few methodological limitations. We only focused on race as a marginalizing identity. Sexual orientation, nativity, citizenship, and gender identity are other sources of marginalizing identities that may reduce the returns of family SEP indicators45,60-62. Similarly, this study only investigated family-level SEP indicators, though we did not have access to family wealth measures. It is still unknown if neighborhood-level SEP also shows any sign of diminished returns. The study also did not investigate any intersectionality between race and gender in this population. In addition, we did not perform multiple comparison corrections. Finally, our analysis measures did not specify factors such as segregation or neighborhood conditions, reports of race-based discrimination of child or family, etc. as possible bases for these diminished returns. Future research may also test if neighborhood SEP or racial or SEP segregation explains diminished returns of family SEP on adverse life experiences. By including contextual data from neighborhoods, schools, friends, and families, we would better understand what factors cause diminished returns of family SEP for racial minorities.
Conclusion
Compared to Whites, racial minority adolescents from high income and married families report higher exposure to adverse life experiences during their transition to adolescence. Higher exposure to adverse life experiences may explain why high SEP racial minority adolescents remain at risk for negative health outcomes that is disproportionate to their SEP. As adverse life events are known risk factors for health and development, efforts should be made to prevent stress in the lives of middle-class minority families.
Disclosures
IRB: Fully de-identified data were utilized for this paper. This study was exempt from a full IRB review. The original ABCD study protocol was approved by the University of California San Diego (UCSD). ABCD data are available to all at NIH NDA website. All adult participants provided consent. Participating adolescents provided assent.
Animal Study: NA
Data Availability: Data used in the preparation of this article were obtained from the Adolescent Brain Cognitive Development (ABCD) Study (https://abcdstudy.org), held in the NIMH Data Archive (NDA). This is a multisite, longitudinal study designed to recruit more than 10,000 children age 9-10 and follow them over 10 years into early adulthood.
Fundings: Shervin Assari research is partially supported by the Regents of the University of California, Tobacco-Related Diseases Research Program, Grant Number No. T32IR5355. The opinions, findings, and conclusions herein are those of the authors and do not necessarily represent The Regents of the University of California, or any of its programs. Alexandra Donovan is funded by the National Institutes of Health, National Institute on Drug Abuse Substance Abuse Research Training (SART) program (1R25DA050723) and National Institute on Minority Health and Health Disparities grant to the Urban Health Institute (S21 MD000103), both at Charles R. Drew University.
ABCD Acknowledgment: The ABCD Study® is supported by the National Institutes of Health and additional federal partners under award numbers U01DA041048, U01DA050989, U01DA051016, U01DA041022, U01DA051018, U01DA051037, U01DA050987, U01DA041174, U01DA041106, U01DA041117, U01DA041028, U01DA041134, U01DA050988, U01DA051039, U01DA041156, U01DA041025, U01DA041120, U01DA051038, U01DA041148, U01DA041093, U01DA041089, U24DA041123, U24DA041147. A full list of supporters is available at https://abcdstudy.org/federal-partners.html. A listing of participating sites and a complete listing of the study investigators can be found at https://abcdstudy.org/consortium_members/. ABCD consortium investigators designed and implemented the study and/or provided data but did not necessarily participate in the analysis or writing of this report. This manuscript reflects the views of the authors and may not reflect the opinions or views of the NIH or ABCD consortium investigators. The ABCD data repository grows and changes over time.
Conflicts of Interest: None.
References
- Felitti VJ, Anda RF, Nordenberg D, et al. Relationship of childhood abuse and household dysfunction to many of the leading causes of death in adults. The Adverse Childhood Experiences (ACE) Study. Am J Prev Med. 1998; 14(4): 245-58.
- Campbell JA, Walker RJ, Egede LE. Associations Between Adverse Childhood Experiences, High-Risk Behaviors, and Morbidity in Adulthood. Am J Prev Med. 2016; 50(3): 344-52.
- Felitti VJ, Anda RF, Nordenberg D, et al. REPRINT OF: Relationship of Childhood Abuse and Household Dysfunction to Many of the Leading Causes of Death in Adults: The Adverse Childhood Experiences (ACE) Study. Am J Prev Med. 2019; 56(6): 774-86.
- Elmore AL, Crouch E. The Association of Adverse Childhood Experiences With Anxiety and Depression for Children and Youth, 8 to 17 Years of Age. Acad Pediatr. 2020.
- Frewen P, Zhu J, Lanius R. Lifetime traumatic stressors and adverse childhood experiences uniquely predict concurrent PTSD, complex PTSD, and dissociative subtype of PTSD symptoms whereas recent adult non-traumatic stressors do not: results from an online survey study. Eur J Psychotraumatol. 2019; 10(1): 1606625.
- Mwachofi A, Imai S, Bell RA. Adverse childhood experiences and mental health in adulthood: Evidence from North Carolina. J Affect Disord. 2020; 267: 251-7.
- Giano Z, Hubach RD, Currin JM, et al. Adverse childhood experiences and MSM marijuana use. Drug Alcohol Depend. 2019; 198: 76-9.
- Assari S, Haidar J. History of Non-Fatal Physical Assault Is Associated with Premature Mortality for Whites but Not Blacks. J—Multidisciplinary Scientific Journal. 2018; 1(1): 81-93.
- Bick J, Nelson CA. Early Adverse Experiences and the Developing Brain. Neuropsychopharmacology. 2016; 41(1): 177-96.
- Allen H, Wright BJ, Vartanian K, et al. Examining the Prevalence of Adverse Childhood Experiences and Associated Cardiovascular Disease Risk Factors Among Low-Income Uninsured Adults. Circ Cardiovasc Qual Outcomes. 2019; 12(9): e004391.
- Lacey RE, Pinto Pereira SM, Li L, et al. Adverse childhood experiences and adult inflammation: Single adversity, cumulative risk and latent class approaches. Brain Behav Immun. 2020.
- Esteves KC, Jones CW, Wade M, et al. Adverse Childhood Experiences: Implications for Offspring Telomere Length and Psychopathology. Am J Psychiatry. 2020; 177(1): 47-57.
- Powell-Wiley TM, Gebreab SY, Claudel SE, et al. The relationship between neighborhood socioeconomic deprivation and telomere length: The 1999-2002 National Health and Nutrition Examination Survey. SSM Popul Health. 2020; 10: 100517.
- Nothling J, Malan-Muller S, Abrahams N, et al. Epigenetic alterations associated with childhood trauma and adult mental health outcomes: A systematic review. World J Biol Psychiatry. 2019: 1-20.
- Tang R, Howe LD, Suderman M, et al. Adverse childhood experiences, DNA methylation age acceleration, and cortisol in UK children: a prospective population-based cohort study. Clin Epigenetics. 2020; 12(1): 55.
- Maguire-Jack K, Lanier P, Lombardi B. Investigating racial differences in clusters of adverse childhood experiences. Am J Orthopsychiatry. 2020; 90(1): 106-14.
- Kaufman JS, Cooper RS, McGee DL. Socioeconomic status and health in blacks and whites: the problem of residual confounding and the resiliency of race. Epidemiology. 1997: 621-8.
- Mock SE, Arai SM. Childhood trauma and chronic illness in adulthood: mental health and socioeconomic status as explanatory factors and buffers. Front Psychol. 2010; 1: 246.
- Lantz PM, House JS, Mero RP, et al. Stress, life events, and socioeconomic disparities in health: results from the Americans' Changing Lives Study. J Health Soc Behav. 2005; 46(3): 274-88.
- Berg AO, Aas M, Larsson S, et al. Childhood trauma mediates the association between ethnic minority status and more severe hallucinations in psychotic disorder. Psychol Med. 2015; 45(1): 133-42.
- Assari S, Lankarani MM, Caldwell CH. Does Discrimination Explain High Risk of Depression among High-Income African American Men? Behav Sci (Basel). 2018; 8(4).
- Hudson DL, Neighbors HW, Geronimus AT, et al. Racial Discrimination, John Henryism, and Depression Among African Americans. J Black Psychol. 2016; 42(3): 221-43.
- Hudson DL, Puterman E, Bibbins-Domingo K, et al. Race, life course socioeconomic position, racial discrimination, depressive symptoms and self-rated health. Soc Sci Med. 2013; 97: 7-14.
- Hudson DL, Bullard KM, Neighbors HW, et al. Are benefits conferred with greater socioeconomic position undermined by racial discrimination among African American men? J Mens Health. 2012; 9(2): 127-36.
- Assari S. Family Socioeconomic Status and Exposure to Childhood Trauma: Racial Differences. Children. 2020; 7(6): 57.
- Assari S. Parental Education and Spanking of American Children: Blacks' Diminished Returns. World J Educ Res. 2020; 7(3): 19-44.
- Assari S, Bazargan M. Unequal associations between educational attainment and occupational stress across racial and ethnic groups. International journal of environmental research and public health. 2019; 16(19): 3539.
- Assari S, Preiser B, Kelly M. Education and Income Predict Future Emotional Well-Being of Whites but Not Blacks: A Ten-Year Cohort. Brain Sci. 2018; 8(7).
- Assari S. Parental Education Better Helps White than Black Families Escape Poverty: National Survey of Children’s Health. Economies. 2018; 6(2): 30.
- Assari S. Health Disparities due to Diminished Return among Black Americans: Public Policy Solutions. Social Issues and Policy Review. 2018; 12(1): 112-45.
- Assari S. Unequal Gain of Equal Resources across Racial Groups. Int J Health Policy Manag. 2017; 7(1): 1-9.
- Assari S, Farokhnia M, Mistry R. Education Attainment and Alcohol Binge Drinking: Diminished Returns of Hispanics in Los Angeles. Behav Sci (Basel). 2019; 9(1).
- Assari S. Parental Education Attainment and Educational Upward Mobility; Role of Race and Gender. Behav Sci (Basel). 2018; 8(11).
- Assari S. Parental Educational Attainment and Mental Well-Being of College Students; Diminished Returns of Blacks. Brain Sci. 2018; 8(11).
- Assari S. Blacks' Diminished Return of Education Attainment on Subjective Health; Mediating Effect of Income. Brain Sci. 2018; 8(9).
- Assari S, Caldwell CH, Mincy R. Family Socioeconomic Status at Birth and Youth Impulsivity at Age 15; Blacks' Diminished Return. Children (Basel). 2018; 5(5).
- Assari S, Caldwell CH, Zimmerman MA. Family Structure and Subsequent Anxiety Symptoms; Minorities' Diminished Return. Brain Sci. 2018; 8(6).
- Assari S, Hani N. Household Income and Children's Unmet Dental Care Need; Blacks' Diminished Return. Dent J (Basel). 2018; 6(2).
- Assari S, Caldwell CH, Mincy RB. Maternal Educational Attainment at Birth Promotes Future Self-Rated Health of White but Not Black Youth: A 15-Year Cohort of a National Sample. J Clin Med. 2018; 7(5).
- Assari S, Thomas A, Caldwell CH, et al. Blacks' Diminished Health Return of Family Structure and Socioeconomic Status; 15 Years of Follow-up of a National Urban Sample of Youth. J Urban Health. 2018; 95(1): 21-35.
- Assari S. Parental education and nucleus accumbens response to reward anticipation: Minorities’ diminished returns. Advances in social science and culture. 2020; 2(4): 132.
- Garavan H, Bartsch H, Conway K, et al. Recruiting the ABCD sample: Design considerations and procedures. Dev Cogn Neurosci. 2018; 32: 16-22.
- Auchter AM, Hernandez Mejia M, Heyser CJ, et al. A description of the ABCD organizational structure and communication framework. Dev Cogn Neurosci. 2018; 32: 8-15.
- Burke NJ, Hellman JL, Scott BG, et al. The impact of adverse childhood experiences on an urban pediatric population. Child Abuse Negl. 2011; 35(6): 408-13.
- Assari S. Education Attainment and Obesity Differential Returns Based on Sexual Orientation. Behav Sci (Basel). 2019; 9(2).
- Assari S. Family Income Reduces Risk of Obesity for White but Not Black Children. Children (Basel). 2018; 5(6).
- Bell CN, Sacks TK, Thomas Tobin CS, et al. Racial Non-equivalence of Socioeconomic Status and Self-rated Health among African Americans and Whites. SSM Popul Health. 2020; 10: 100561.
- Hudson D, Sacks T, Irani K, et al. The Price of the Ticket: Health Costs of Upward Mobility among African Americans. Int J Environ Res Public Health. 2020; 17(4).
- Hudson DL, Neighbors HW, Geronimus AT, et al. The relationship between socioeconomic position and depression among a US nationally representative sample of African Americans. Soc Psychiatry Psychiatr Epidemiol. 2012; 47(3): 373-81.
- Forster M, Rogers CJ, Benjamin SM, et al. Adverse Childhood Experiences, Ethnicity, and Substance Use among College Students: Findings from a Two-State Sample. Subst Use Misuse. 2019; 54(14): 2368-79.
- Melka A, Chojenta C, Holliday E, et al. Adverse childhood experiences and electronic cigarette use among young Australian women. Prev Med. 2019; 126: 105759.
- Assari S, Boyce S, Bazargan M, et al. Place-Based Diminished Returns of Parental Educational Attainment on School Performance of Non-Hispanic White Youth. Frontiers in Education. 2020; 5(30).
- Shanika Boyce MB, Cleopatra Caldwell, Marc Zimmerman, et al. Protective Effects of Parental Educational Attainment on School Social Environmental Risk: Blacks’ Diminished Returns in Urban Public Schools. Children. 2020.
- Assari S, Boyce S, Bazargan M, et al. Mathematical Performance of American Youth: Diminished Returns of Educational Attainment of Asian-American Parents. Education Sciences. 2020; 10(2): 32.
- Assari S, Caldwell CH, Bazargan M. Association Between Parental Educational Attainment and Youth Outcomes and Role of Race/Ethnicity. JAMA Netw Open. 2019; 2(11): e1916018.
- Assari S. Unequal Gain of Equal Resources across Racial Groups. Int J Health Policy Manag. 2018; 7(1): 1-9.
- Bartik TJ, Hershbein B. Degrees of poverty: The relationship between family income background and the returns to education. 2018.
- Thomas A, Caldwell CH, Assari S, et al. You do what you see: How witnessing physical violence is linked to violent behavior among male African American adolescents. The Journal of Men’s Studies. 2016; 24(2): 185-207.
- Boelens M, Windhorst DA, Jonkman H, et al. Evaluation of the promising neighbourhoods community program to reduce health inequalities in youth: a protocol of a mixed-methods study. BMC Public Health. 2019; 19(1): 555.
- Assari S, Bazargan M. Educational Attainment and Subjective Health and Well-Being; Diminished Returns of Lesbian, Gay, and Bisexual Individuals. Behavioral Sciences. 2019; 9(9): 90.
- Assari S. Socioeconomic Status and Self-Rated Oral Health; Diminished Return among Hispanic Whites. Dent J (Basel). 2018; 6(2).
- Assari S. Socioeconomic Determinants of Systolic Blood Pressure; Minorities’ Diminished Returns. Journal of Health Economics and Development. 2019; 1(1): 1-11.
Appendix 1
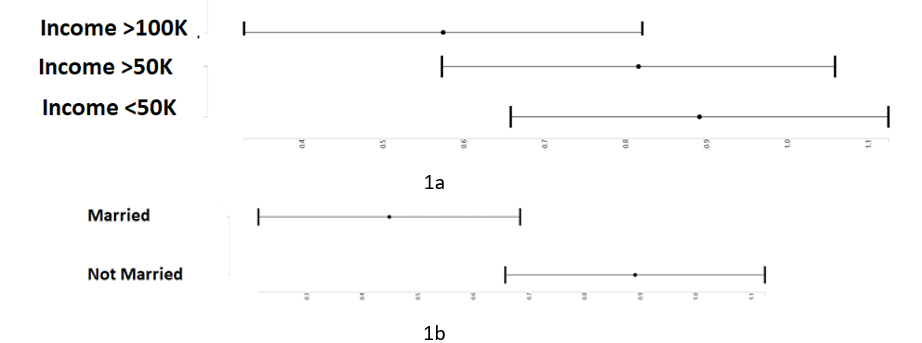
Appendix Figure 1: Least square mean score of log (adverse life experience) by intersections of family income (1a), and family structure (1b) overall during transition to adolescence
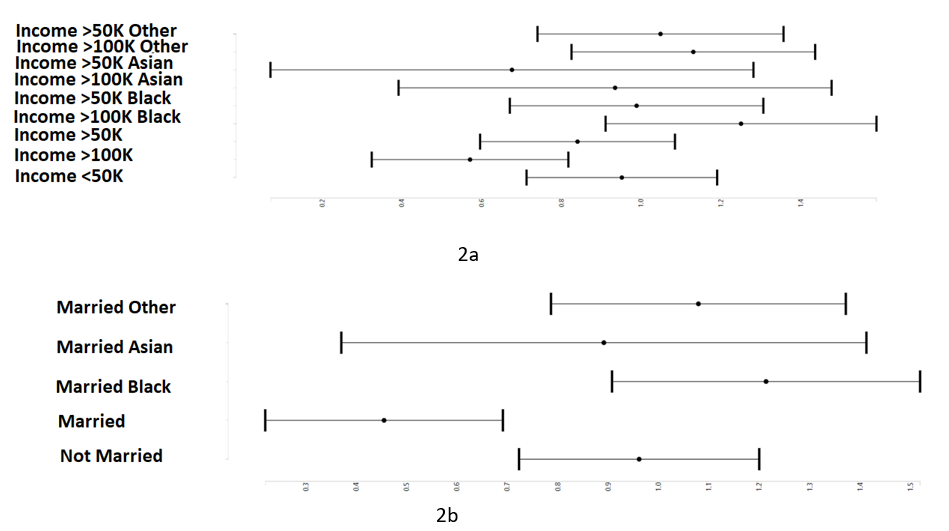
Appendix Figure 2: Least square mean score of log (adverse life experience) by intersections of family income (2a), and family structure (2b) by race during transition to adolescence