
Parents’ Perceived Neighborhood Safety and Children's Internalizing Symptoms: Race and Socioeconomic Status Differences
Shervin Assari*1,2, MD, MPH
1Department of Family Medicine, Charles R Drew University of Medicine and Science, Los Angeles, CA, USA
2Department of Urban Public Health, Charles R Drew University of Medicine and Science, Los Angeles, CA, USA
Abstract
Background: In the United States, due to residential segregation, racial minorities and families with low socioeconomic status (SES) tend to live in less safe neighborhoods than their White and high SES counterparts. As such, in the US, race, and SES closely correlate with neighborhood safety. Due to the high chronicity of stress in unsafe neighborhoods, perceived neighborhood safety may be a mechanism through which race and SES are linked to children’s mental health. Simultaneously, race and SES may alter the effects of perceived neighborhood safety on children's mental health. Aim: To explore racial and SES differences in the effects of neighborhood safety on children's internalizing symptoms, we compared racially and SES diverse groups of American children for the effects of parents’ perceived neighborhood safety on children's internalizing symptoms. Methods: This cross-sectional study included 10484 children from the Adolescent Brain Cognitive Development (ABCD) study. Mixed-effects regression was used for data analysis. The predictor variable was parents’ perceived neighborhood safety which was treated as a continuous measure. The primary outcome was children's internalizing symptoms reported by children. Race, parental education, household income, and family structure were moderators. Results: Overall, the parents' high neighborhood safety was associated with lower levels of internalizing symptoms in children. Race and household income showed statistically significant interactions with subjective neighborhood safety on children's internalizing symptoms. Parents’ perceived neighborhood safety showed a stronger inverse association with children's internalizing symptoms for Black than White families. Parents’ perceived neighborhood safety showed a stronger inverse association with children's internalizing symptoms for high-income than low-income families. Parental education or family structure did not show any significant interaction with parents’ perceived neighborhood safety on children’s internalizing symptoms. Conclusion: The degree to which neighborhood safety may be associated with children's internalizing symptoms may depend on race and household income. Some of the effects of race and SES on children’s mental health outcomes may be due to interactions with contextual factors such as neighborhood safety. More research is needed on why and how diverse racial and SES groups differ in the association between perceived neighborhood safety and children’s well-being.
Introduction
Significant racial and socioeconomic status (SES) gaps exist in American children's internalizing symptoms1-8. For example, children from Black families and low SES backgrounds remain at a higher risk of internalizing symptoms than White and high SES children4,8,9. As childhood internalizing symptoms are predictors of later substance use, poor academic performance, obesity, chronic disease, and low quality of life, there is an interest in studying social factors that contribute to racial and SES variation in internalizing symptoms among children 10-19. Such results may help us eliminate subsequent inequalities later in life by early interventions in children's lives20-23.
In the United States (US), race, SES, and place (e.g., neighborhood safety) closely overlap24-26. Due to low SES and living in less safe neighborhoods, racial minority and low SES children experience poor access to educational resources and higher levels of economic, housing, and food insecurity, as well as neighborhood stress7,27-29. As such, at least some of the racial and SES gaps in internalizing symptoms may be due to racial and SES gaps in neighborhood characteristics such as perceived neighborhood safety30-32.
Above and beyond race and SES, a wide range of neighborhood characteristics, including but not limited to perceived neighborhood safety9,32-39, correlate with children's emotional outcomes40-43. White and higher SES children reside in safer neighborhoods, have access to more resources, experience less neighborhood stress, and as a result, may show higher emotional development40-43. As such, neighborhood characteristics such as perceived neighborhood safety may operate as an underlying mechanism that generates emotional, behavioral, and developmental inequalities across diverse racial and SES groups of children44-46. Families with low SES backgrounds and those in unsafe neighborhoods may be less likely to engage in positive parenting, which has lasting effects on children’s emotional and cognitive development47-49. Children from White and high SES families are more likely to live in safe neighborhoods and attend high-quality schools with many educational resources and highly skilled teachers50-52. Such stimulating environments further promote White and high SES children's emotional development across domains53. Low SES Black children attend low-resource unsafe schools that further deteriorate their emotional and behavioral well-being54-58. All these mechanisms may explain why we observe strong links between race and SES with poor children's emotional and behavioral development, along with links between neighborhood and school risk with poor children's emotional and behavioral development59-63.
While various aspects of the physical and social environment may all influence children's emotional and behavioral development, research has shown different effects of subjective and objective indicators of neighborhood safety on emotional and health outcomes64. However, very few studies have tested differential effects of subjective neighborhood safety on children’s emotional outcomes across diverse racial and SES groups. While objective aspects of the environment reflect actual crime rates and other environmental safety measures65-68, subjective neighborhood safety carries another type of information that may influence children's health and behaviors9,69-72. As such, there is a need to study how subjective aspects of the neighborhood, such as perceived neighborhood safety, contribute to racial and SES inequalities in internalizing symptoms of children40-43. There is very limited knowledge on whether subjective and objective proxies of neighborhood safety differently correlate with children’s developmental outcomes across racial and SES groups73-75, particularly while family SES indicators such as income and parental education are controlled64-66,68,76,77. Different population groups may respond differently to distress and insecurity due to lack of neighborhood safety, neighborhood stress, fear of violence, or even exposure to trauma78,79.
Recent research suggests that social groups, particularly racial groups, widely differ in their sensitivity to SES80-85 as well as neighborhood characteristics86,87. We know that family SES such as parental education and household income, impact children's development across domains88. Recent research shows that these effects may differ across racial and SES groups80-85. To have a comprehensive understanding of children's exposure to stress, there is a need to study how neighborhood safety influences diverse racial and SES groups. Complementary to the effects of family SES, parents’ subjective neighborhood safety can reflect how parents and family allow the child to be engaged in the community and neighborhood and to what degree the child becomes exposed to neighborhood stress. Still, there is a need to extend this literature to test the multiplicative effects of race, SES, and subjective neighborhood safety on child development89-91. Thus, there is a need for studies that compare diverse racial and SES groups for the effects of subjective environmental safety on children’s internalizing symptoms79,92.
Aims
To enhance the existing knowledge on the topic of race, SES, neighborhood safety, and children's emotional outcomes in the US, we conducted this study with three aims. First, to test the association between parents’ subjective neighborhood safety and children's internalizing symptoms in a large national sample of 9-10 year old children. Second, we compared children's racial and SES groups for the associations between parents’ subjective neighborhood safety and children's internalizing symptoms. Third, we aimed to test if racial differences in the effect of perceived neighborhood safety on children's internalizing symptoms are due to the differential family income. We expected protective effects of parents’ subjective neighborhood safety on children's internalizing symptoms57,93,94. However, we expected this association to differ between diverse racial groups of children. We also expected the observed racial differences to be due to differential family income.
Methods
Design
This is a secondary analysis of wave 1 data of the Adolescent Brain Cognitive Development (ABCD) study95-99, a landmark children's brain development study in the US. More nuanced data on the details of the ABCD study is available here95,100. The ABCD study's baseline data collection occurred between the years 2016 and 2018.
Sampling
In the ABCD study, participants were limited to 9-10 years old children who were recruited from multiple cities across several states. In total, there were 21 ABCD centers that were involved in the recruitment of the children. The main strategy to recruit participants to the ABCD study was to focus on the US school system101. The current analysis's eligibility criteria included valid data on race, demographic factors, SES, neighborhood safety, and internalizing symptoms (n = 10484).
Study Variables
The study variables included race (moderator), age, sex, parental education, household income, family marital status (confounders), subjective neighborhood safety (independent variable), and children's internalizing symptoms (dependent variable).
Demographic and Socioeconomic Confounders
Age, sex, ethnicity, parental education, household income, and parental marital status were the confounders. Parents were asked to report the age of their children. Age was a continuous variable, measured in months. Sex was a dichotomous variable with 1 for males and 0 for females. Ethnicity was reported by parents and was a dichotomous variable: 1 for Hispanic and 0 for non-Hispanic.
Primary Outcome
- Children’s Internalizing Symptoms: We used the Child Behavior Checklist (CBCL)102 to measure internalizing symptoms in children. The CBCL103-108, also known as the Achenbach System of Empirically Based Assessment, generates eight outcomes, including internalizing symptoms. The CBCL internalizing symptoms closely correlate with the Diagnostic and Statistical Manual of Mental Disorders (DSM-IV-TR) based diagnosis of depression and conduct disorder103-108. The CBCL instrument uses parental reports to screen for emotional and behavioral problems in children. The CBCL is one of the most commonly used measures of child psychopathology and has been implemented in schools, medical settings, mental health facilities, child and family services, Health Management Organizations, and public health agencies103-108. CBCL has been used by thousands of published scholarly articles103-108.
- Independent Variables
Parents’ Subjective Neighborhood Safety: Parents reported their sense of community safety. These items are developed by Diez Roux and colleagues109. Items included "I feel safe walking in my neighborhood, day or night.", "Violence is not a problem in my neighborhood.", and "My neighborhood is safe from crime." These questions were administered in two languages: English and Spanish. Responses were 1 = Strongly Disagree; 2 = Disagree; 3 = Neutral (neither agree nor disagree)/ Neutral; 4 = Agree; 5 = Strongly Agree. We calculated the mean of the three items109. This variable was treated as a continuous variable109. A higher score denoted higher neighborhood safety.
- Moderators
Race: Race was self-identified by the parents. Race was a categorical variable: White, Black, Asian, and other race/mixed.
Household Income: Household income was a three-level categorical variable: Less than 50K, 50-100K, and 100K+, as reported by the parent.
Parental Education: Parental education was a categorical variable: less than high school, high school completed, some college, Bachelor's degree, and postgraduate studies.
Family Structure: Parental marital status was equal to 1 for married and equal to 0 for unmarried.
- Data Analysis
We used the Data Analysis and Exploration Portal (DEAP) for data analysis. DEAP is a statistical package specifically designed for the analysis of ABCD data. Mean, standard deviation (SD), frequency, and relative frequency were reported. We performed the analysis of variance (ANOVA) and a Chi-square test to test group differences in the association between race and our study variables. We also ruled out multi-collinearity between our study variables. Error terms showed near to normal distribution. We applied mixed-effects linear regression models for our multivariable models to adjust for nesting of participants to families and sites. All our regression models were performed in the overall sample. For our analyses, we used the propensity score to generate the results that are representative of the US. We ran similar series of models for testing the following moderators: 1) race, 2) household income, 3) parental education, and 4) family structure. Our Model 1 did not have the interaction terms. Our Model 2 added interaction terms between race, household income, parental education, family structure, and subjective neighborhood safety. When we tested the role of race as the moderator, our Model 3 also controlled for household income. From our models, we reported b, standard error (SE), and p values. A p less than 0.05 was considered statistically significant.
2.4.5. Ethical Aspect
This analysis was exempted from a full Institutional Review Board (IRB) review by Charles R Drew University of Medicine. The mother study (ABCD), however, was approved by the IRB at the University of California, San Diego (UCSD). Assent and consent were received from children and their parents, respectively100.
Results
Descriptives
Table 1 shows that 10484, 9-10-year-old children were included in the current analysis. From this number, Whites were the majority followed by Other/Mixed and Black. Only a small minority were Asian. Subjective neighborhood safety was lowest in Black and Other/Mixed race parents (p < 0.05). Asian and White families had the highest parental education and household income, and Black and Other/Mixed race families had the lowest parental education and household income (p < 0.05). Asian American children had lower internalizing symptoms compared to other racial groups (p < 0.05).
Table 1.Descriptive data overall and by race
|
level |
Overall |
|
White |
Black |
Asian |
Other/Mixed |
p |
|||||
|
|
|
Weighted |
|
Weighted |
|
Weighted |
|
Weighted |
|
Weighted |
|
Weighted |
|
n |
10484 |
|
7376 |
1762 |
266 |
1967 |
||||||
|
|
Mean(SD) |
Mean(SD) |
Mean(SD) |
Mean(SD) |
Mean(SD) |
Mean(SD) |
Mean(SD) |
Mean(SD) |
Mean(SD) |
Mean(SD) |
|
|
|
Age (Months) |
118.96 (7.47) |
119.22(7.48) |
119.04 (7.50) |
119.31(7.51) |
118.86 (7.27) |
119.15(7.28) |
119.53 (7.74) |
119.77(7.74) |
118.71 (7.49) |
118.84(7.55) |
0.189 |
0.135 |
|
Internalizing Symptoms |
48.15 (10.54) |
48.75(10.79) |
48.12 (10.06) |
48.87(10.41) |
47.57 (11.66) |
47.73(11.86) |
44.66 (9.20) |
44.89(9.12) |
49.08 (11.23) |
49.66(11.49) |
< 0.001 |
< 0.001 |
|
Subjective Neighborhood Safety |
3.92 (0.96) |
3.89(0.97) |
4.08 (0.85) |
4.04(0.88) |
3.31 (1.13) |
3.27(1.14) |
4.02 (0.92) |
4.01(0.91) |
3.72 (1.01) |
3.63(1.05) |
< 0.001 |
< 0.001 |
|
|
N(%) |
% |
N(%) |
% |
N(%) |
% |
N(%) |
% |
N(%) |
% |
|
|
|
Parental Education |
|
|
|
|
|
|
|
|
|
|
|
|
|
< HS Diploma |
384 (3.7) |
(4.6) |
199 (2.7) |
(3.6) |
149 (8.5) |
(9.6) |
7 (2.6) |
(2.5) |
138 (7.0) |
(10.1) |
< 0.001 |
< 0.001 |
|
HS Diploma/GED |
865 (8.3) |
(9.9) |
380 (5.2) |
(6.8) |
430 (24.4) |
(26.6) |
4 (1.5) |
(1.9) |
225 (11.4) |
(16.1) |
|
|
|
Some College |
2690 (25.7) |
(30.0) |
1574 (21.3) |
(26.9) |
698 (39.6) |
(40.9) |
18 (6.8) |
(7.3) |
664 (33.8) |
(39.3) |
|
|
|
Bachelor |
2787 (26.6) |
(25.1) |
2167 (29.4) |
(27.8) |
252 (14.3) |
(12.8) |
75 (28.2) |
(29.3) |
452 (23.0) |
(18.8) |
|
|
|
Post Graduate Degree |
3758 (35.8) |
(30.4) |
3056 (41.4) |
(34.9) |
233 (13.2) |
(10.0) |
162 (60.9) |
(59.0) |
488 (24.8) |
(15.7) |
|
|
|
Married Family |
|
|
|
|
|
|
|
|
|
|
|
|
|
No |
3184 (30.4) |
(37.1) |
1571 (21.3) |
(29.6) |
1241 (70.4) |
(76.9) |
37 (13.9) |
(15.4) |
761 (38.7) |
(48.0) |
< 0.001 |
< 0.001 |
|
Yes |
7300 (69.6) |
(62.9) |
5805 (78.7) |
(70.4) |
521 (29.6) |
(23.1) |
229 (86.1) |
(84.6) |
1206 (61.3) |
(52.0) |
||
|
Sex |
|
|
|
|
|
|
|
|
|
|
|
|
|
Female |
5031 (48.0) |
(49.0) |
3461 (46.9) |
(47.9) |
892 (50.6) |
(51.7) |
138 (51.9) |
(52.4) |
960 (48.8) |
(50.2) |
0.016 |
0.043 |
|
Male |
5453 (52.0) |
(51.0) |
3915 (53.1) |
(52.1) |
870 (49.4) |
(48.3) |
128 (48.1) |
(47.6) |
1007 (51.2) |
(49.8) |
||
|
Hispanic |
|
|
|
|
|
|
|
|
|
|
|
|
|
No |
8505 (81.1) |
(77.6) |
6058 (82.1) |
(79.1) |
1678 (95.2) |
(92.7) |
245 (92.1) |
(95.5) |
1147 (58.3) |
(44.3) |
< 0.001 |
< 0.001 |
|
Yes |
1979 (18.9) |
(22.4) |
1318 (17.9) |
(20.9) |
84 (4.8) |
(7.3) |
21 (7.9) |
(4.5) |
820 (41.7) |
(55.7) |
||
|
Family Income |
|
|
|
|
|
|
|
|
|
|
|
|
|
< 50K |
3008 (28.7) |
(38.1) |
1264 (18.2) |
(28.6) |
1004 (66.1) |
(74.9) |
37 (15.9) |
(19.7) |
703 (39.5) |
(54.9) |
< 0.001 |
< 0.001 |
|
> =50K& < 100K |
3000 (28.6) |
(31.4) |
2120 (30.5) |
(34.6) |
338 (22.2) |
(19.1) |
53 (22.7) |
(29.5) |
489 (27.5) |
(27.7) |
|
|
|
> =100K |
4476 (42.7) |
(30.5) |
3569 (51.3) |
(36.8) |
178 (11.7) |
(6.0) |
143 (61.4) |
(50.8) |
586 (33.0) |
(17.4) |
|
|
Table 2 presents the fit of our three mixed-effects regression models in the overall sample. As shown by this table, the inclusion of interaction terms between race and subjective neighborhood safety helped explain a larger variance of the outcome (Model 2 compared to Model 1). Similarly, adding income showed an enhanced fit in Model 3 compared to Model 2. Comparison of Model 4 and Model 5 also showed that interaction between household income and subjective neighborhood safety helped explain a larger variance of the outcome (Model 5 compared to Model 4).
Table 2. Model fit
|
|
Model 1 Main Effect of Race and Parental Education and Income |
Model 2 Moderating Effect of Race without Income |
Model 3 Moderating Effect of Race without Income |
Model 4 Main Effect of Household Income and Race without Parental Education |
Model 5 Moderating Effect of Household Income |
|
N |
10484 |
10484 |
11371 |
10496 |
10496 |
|
R-squared |
0.03693 |
0.03729 |
0.03164 |
0.03394 |
0.03394 |
|
ΔR-squared |
0.00793 (0.79%) |
0.01469 (1.47%) |
0.01553 (1.55%) |
0.02128 (2.13%) |
0.02128 (2.13%) |
Multivariate Analysis
Table 2 provides the fit of our regression models. In Table 3, three linear regression models report the association of interest between subjective neighborhood safety and internalizing symptoms in the overall (pooled) sample. Model 1 (Main Effect of Race) showed that high subjective neighborhood safety was associated with lower internalizing symptoms in children. Model 2 (Interaction of Race and Neighborhood Safety) showed statistically significant interactions between the effects of race and subjective neighborhood safety on children's internalizing symptoms, suggesting that the effect of high subjective neighborhood safety on internalizing symptoms is larger for Black and Other/Mixed race than White children. However, these interactions could be explained by household income in Model 3 (Table 3).
Table 3. Summary of mixed-effects regressions on the association between subjective neighborhood safety and children's internalizing symptoms overall and by race
|
|
Model 1 |
|
|
|
|
Model 2 |
|
|
|
|
Model 3 |
|
|
|
|
|
|
B |
SE |
p |
Sig |
|
B |
SE |
p |
Sig |
|
B |
SE |
p |
Sig |
|
|
Neighborhood safety |
-0.91 |
0.10 |
< 0.001 |
* * * |
|
-0.77 |
0.12 |
< 0.001 |
* * * |
|
-0.78 |
0.12 |
< 0.001 |
* * * |
|
|
Race(Black) |
-2.52 |
0.35 |
< 0.001 |
* * * |
|
-0.85 |
0.90 |
0.342 |
|
|
-1.16 |
0.96 |
0.226 |
|
|
|
Race(Asian) |
-2.97 |
0.61 |
< 0.001 |
* * * |
|
-0.01 |
2.03 |
0.996 |
|
|
-1.78 |
2.21 |
0.419 |
|
|
|
Race(Mixed/Other) |
0.04 |
0.27 |
0.897 |
|
|
1.98 |
0.92 |
0.030 |
* |
|
1.57 |
0.96 |
0.103 |
|
|
|
Parental education (HS Diploma/GED) |
-1.13 |
0.67 |
0.091 |
# |
|
-1.03 |
0.55 |
0.058 |
# |
|
-1.11 |
0.67 |
0.096 |
# |
|
|
Parental education (Some College) |
0.82 |
0.61 |
0.180 |
|
|
0.58 |
0.51 |
0.253 |
|
|
0.83 |
0.61 |
0.173 |
|
|
|
Parental education (Bachelor) |
-0.17 |
0.65 |
0.792 |
|
|
-0.80 |
0.53 |
0.134 |
|
|
-0.15 |
0.65 |
0.813 |
|
|
|
Parental education (Post Graduate Degree) |
-1.00 |
0.66 |
0.131 |
|
|
-1.95 |
0.53 |
0.000 |
* * * |
|
-0.96 |
0.66 |
0.144 |
|
|
|
Married family |
-0.96 |
0.27 |
0.000 |
* * * |
|
-1.70 |
0.25 |
< 0.001 |
* * * |
|
-0.96 |
0.27 |
0.000 |
* * * |
|
|
Age (Month) |
-0.02 |
0.01 |
0.001 |
* * * |
|
-0.02 |
0.01 |
< 0.001 |
* * * |
|
-0.02 |
0.01 |
0.001 |
* * * |
|
|
Sex (Male) |
0.10 |
0.12 |
0.414 |
|
|
0.09 |
0.12 |
0.465 |
|
|
0.09 |
0.12 |
0.459 |
|
|
|
Hispanic |
-1.03 |
0.31 |
0.001 |
* * * |
|
-0.78 |
0.29 |
0.008 |
* * |
|
-1.01 |
0.31 |
0.001 |
* * |
|
|
Race(Black) x Neighborhood safety |
- |
- |
- |
- |
- |
-0.48 |
0.24 |
0.044 |
* |
|
-0.37 |
0.25 |
0.146 |
|
|
|
Race(Asian) x Neighborhood safety |
- |
- |
- |
- |
- |
-0.60 |
0.49 |
0.218 |
|
|
-0.29 |
0.52 |
0.574 |
|
|
|
Race(Mixed/Other) x Neighborhood safety |
- |
- |
- |
- |
- |
-0.48 |
0.23 |
0.035 |
* |
|
-0.40 |
0.24 |
0.099 |
# |
|
|
Household income (> =100K) |
-2.37 |
0.36 |
< 0.001 |
* * * |
|
- |
- |
- |
- |
- |
-2.34 |
0.36 |
< 0.001 |
* * * |
|
|
Household income (> =50K& < 100K) |
-0.60 |
0.31 |
0.056 |
# |
|
- |
- |
- |
- |
- |
-0.56 |
0.31 |
0.072 |
# |
|
#p<0.1 *p<0.05 **p<0.01 ***p<0.001
In Figure 1-a, there was an overall inverse association between subjective neighborhood safety and internalizing symptoms. As shown by Figure 1-b, the effects of high subjective neighborhood safety on internalizing symptoms were larger for Black and other non-White children than White children. Figures 1-c to 1-f show our association across racial groups.
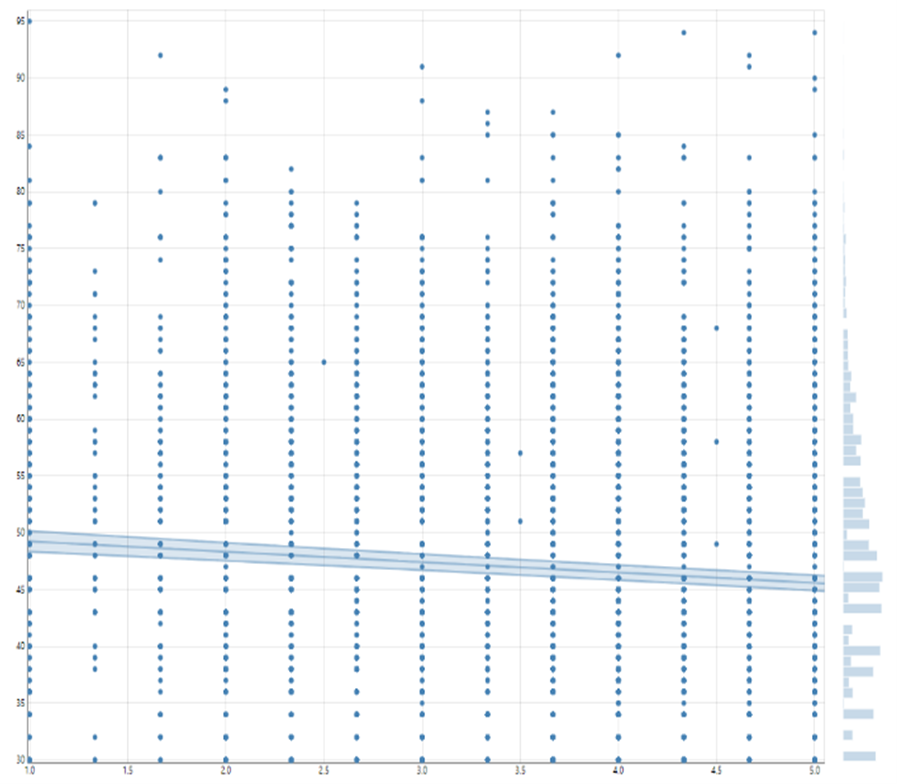
Figure 1-a: overall association
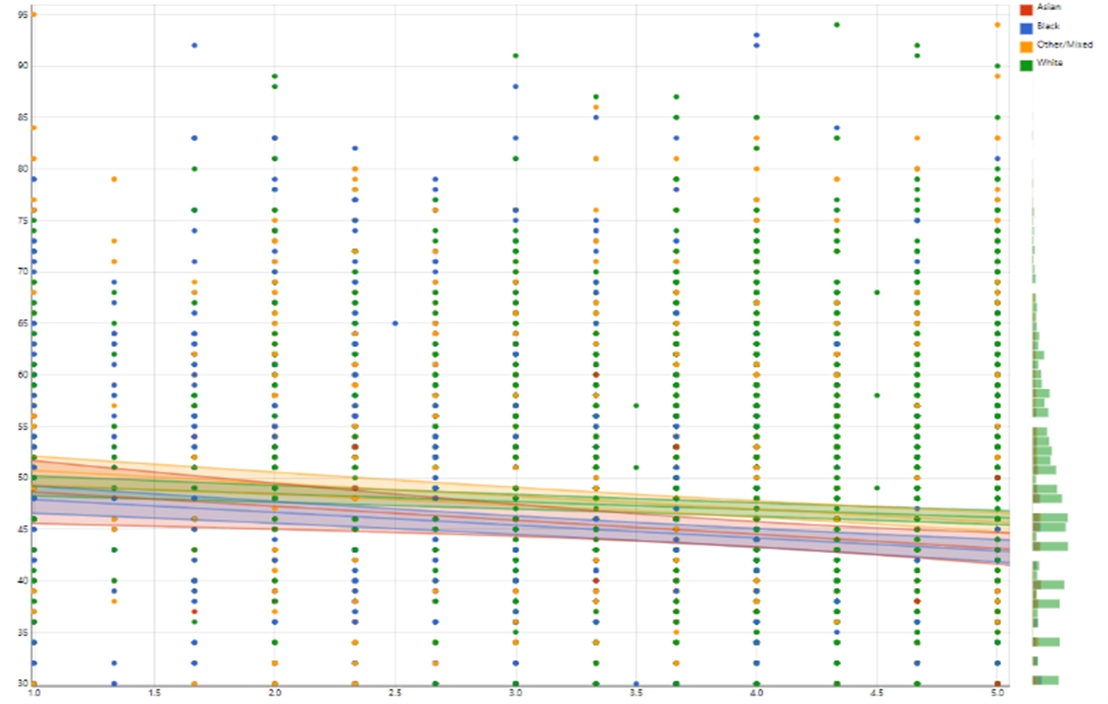
Figure 1-b: association by race
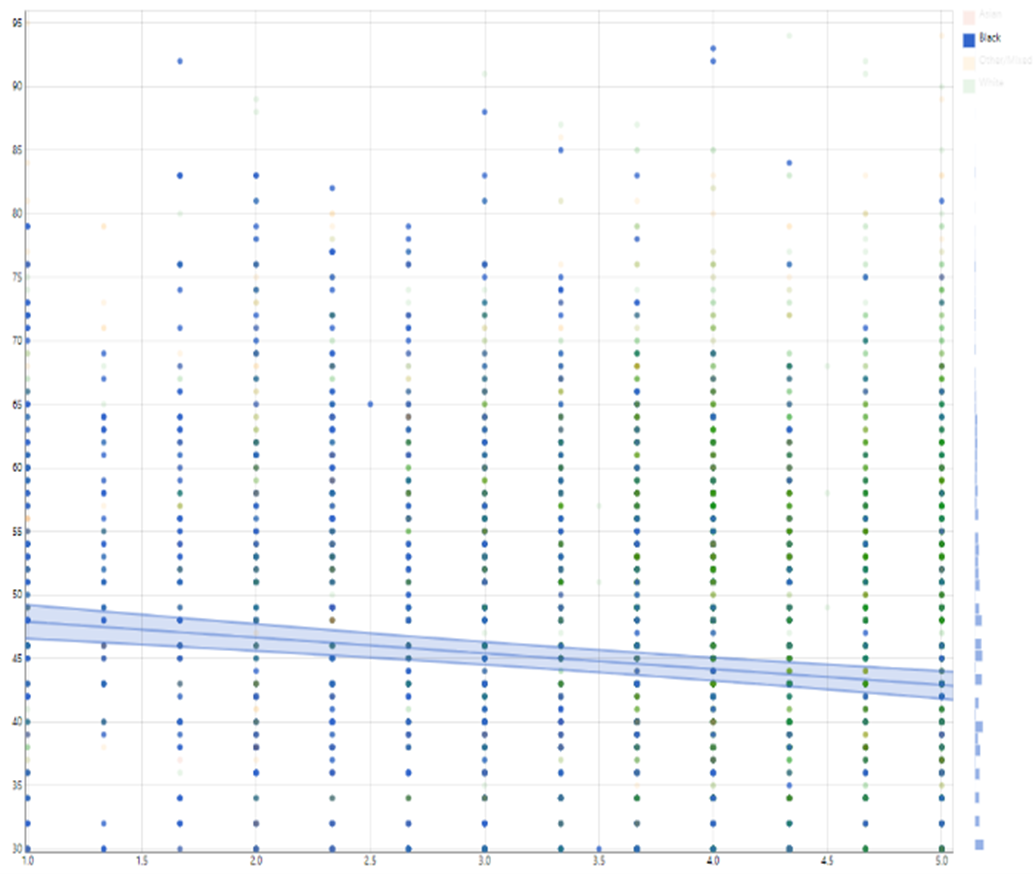
Figure 1-c: association among Blacks
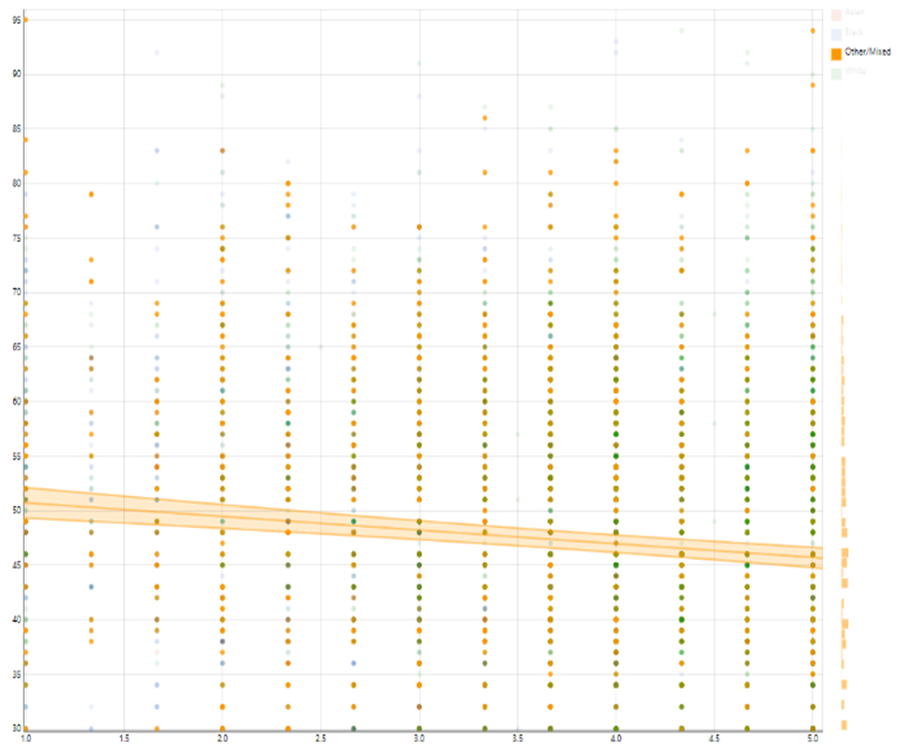
Figure 1-d: association among other race group
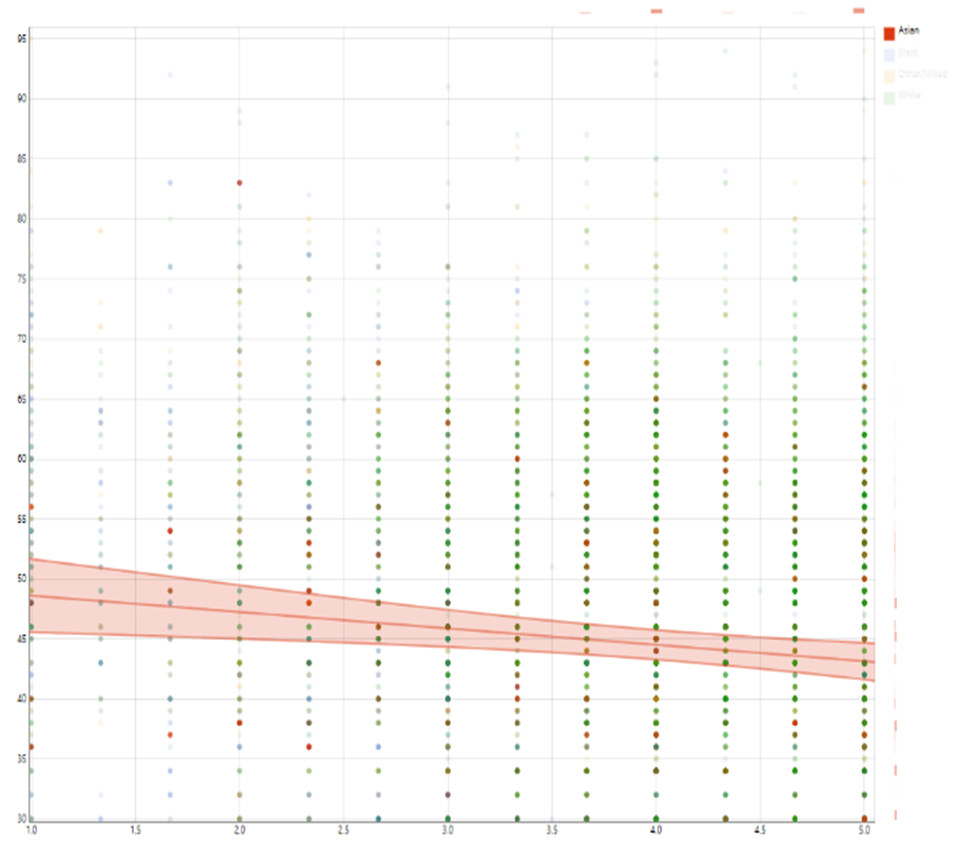
Figure 1-e: association among Asians
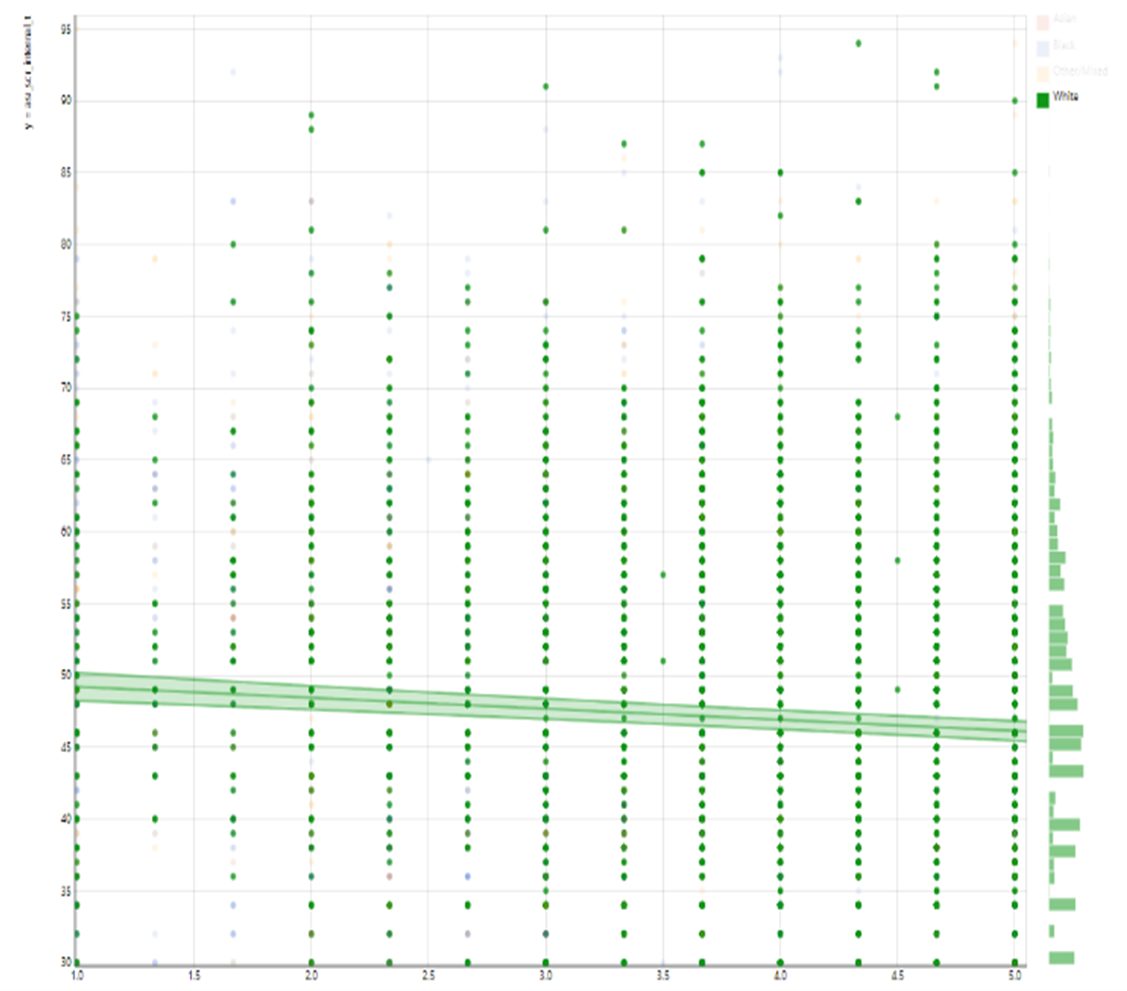
Figure 1-f: association among Whites
Figure 1: Association between subjective neighborhood safety and internalizing symptoms overall and by race
X Axis: Parents’ Perceived Neighborhood Safety
Y Axis: Children’s Internalizing Symptoms
Multivariate Analysis
In Table 4, two mixed-effects linear regression models report the association of interest between subjective neighborhood safety and internalizing symptoms in the overall (pooled) sample. Model 4 (Main Effect) showed that high subjective neighborhood safety was associated with lower internalizing symptoms in children. Model 5 (Interaction of Income and Neighborhood Safety) showed a statistically significant interaction between the effects of household income and subjective neighborhood safety on children's internalizing symptoms, suggesting that the effect of high subjective neighborhood safety on internalizing symptoms is larger for high-income than low-income families (Table 4).
Table 4: Summary of mixed-effects regressions on the association between subjective neighborhood safety and children's internalizing symptoms by household income
|
|
Model 4 |
|
|
|
|
|
|
Model 5 |
|
|
|
|
|
|
|
|
|
B |
SE |
|
|
|
|
B |
SE |
|
|
|
|
|
|
|
|
Neighborhood safety |
-1.00 |
0.10 |
< 1e-6 |
* * * |
|
|
-0.87 |
0.15 |
< 1e-6 |
* * * |
|
|
|
|
|
|
Race(Black) |
-2.70 |
0.35 |
< 1e-6 |
* * * |
|
|
-2.66 |
0.35 |
< 1e-6 |
* * * |
|
|
|
|
|
|
Race(Asian) |
-3.05 |
0.63 |
0.000 |
* * * |
|
|
-3.06 |
0.63 |
0.000 |
* * * |
|
|
|
|
|
|
Race(Mixed/Other) |
0.01 |
0.28 |
0.960 |
|
|
|
0.02 |
0.28 |
0.945 |
|
|
|
|
|
|
|
Household income (> =50K& < 100K) |
-0.79 |
0.29 |
0.007 |
* * |
|
|
-0.52 |
1.02 |
0.611 |
|
|
|
|
|
|
|
Household income (> =100K) |
-2.83 |
0.32 |
< 1e-6 |
* * * |
|
|
-1.26 |
0.95 |
0.187 |
|
|
|
|
|
|
|
Married family |
-1.21 |
0.28 |
0.000 |
* * * |
|
|
-1.21 |
0.28 |
0.000 |
* * * |
|
|
|
|
|
|
Age (Month) |
-0.01 |
0.01 |
0.045 |
* |
|
|
-0.01 |
0.01 |
0.055 |
# |
|
|
|
|
|
|
Sex (Male) |
0.38 |
0.13 |
0.004 |
* * |
|
|
0.38 |
0.13 |
0.004 |
* * |
|
|
|
|
|
|
Hispanic |
-1.02 |
0.31 |
0.001 |
* * * |
|
|
-1.00 |
0.31 |
0.001 |
* * |
|
|
|
|
|
|
Household income (> =50K& < 100K) x Neighborhood safety |
|
|
|
|
|
|
0.10 |
0.24 |
0.670 |
|
|
|
|
|
|
|
Household income (> =100K) x Neighborhood safety |
|
|
|
|
|
|
-0.56 |
0.24 |
0.021 |
* |
|
|
|
|
|
#p<0.1 *p<0.05 **p<0.01 ***p<0.001
In Figure 2-a, there was an overall inverse association between subjective neighborhood safety and internalizing symptoms. As shown by Figure 2-b, the inverse association between high subjective neighborhood safety of parents and children’s internalizing symptoms was stronger for high-income than low-income children. Figures 2-c to 2-e show our association across income groups.
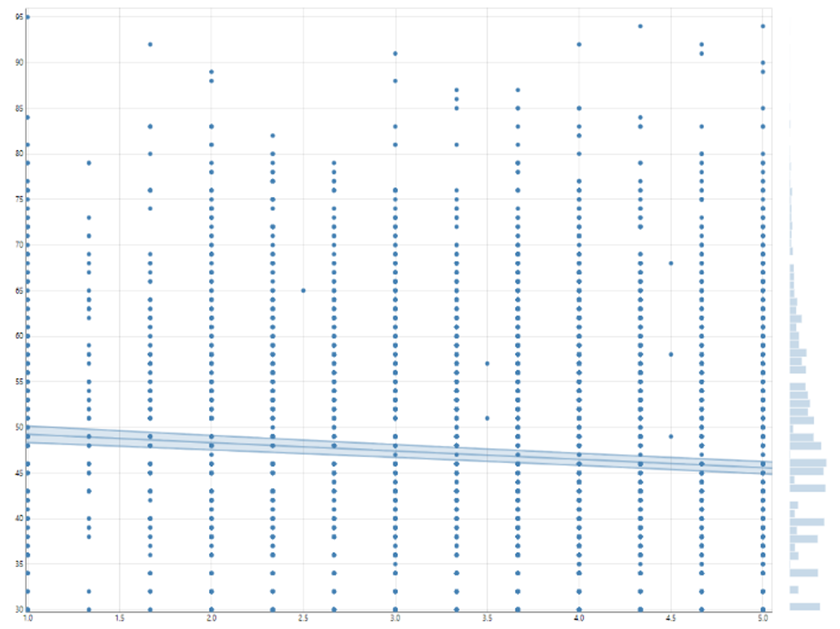
Figure 2-a: association overall
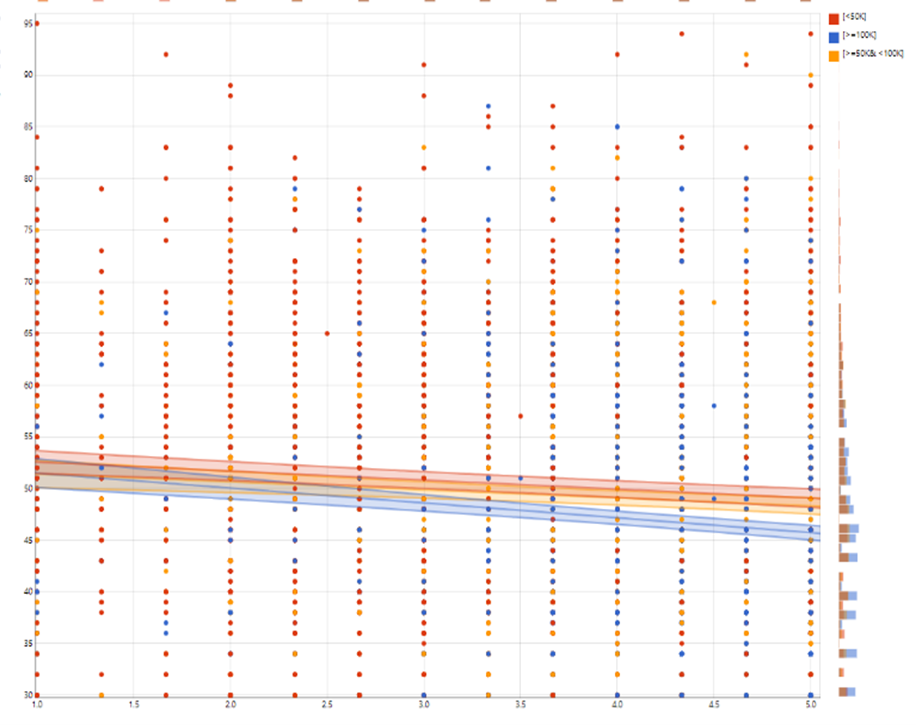
Figure 2-b: association by household income
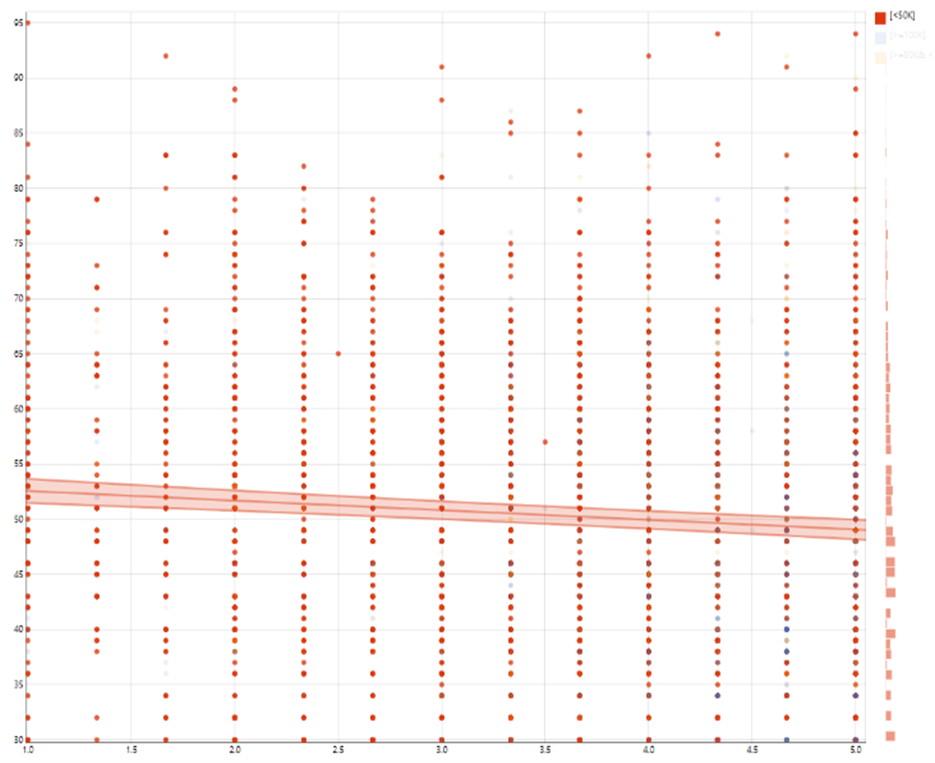
Figure 2-c: association among families with low-income
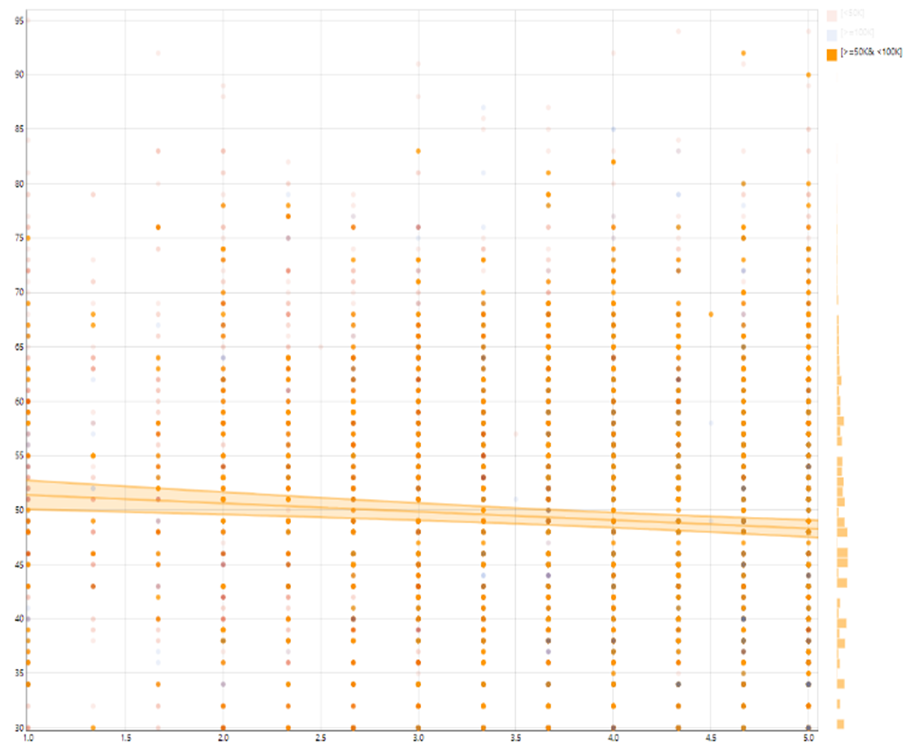
Figure 2-d: association among families with mid-income
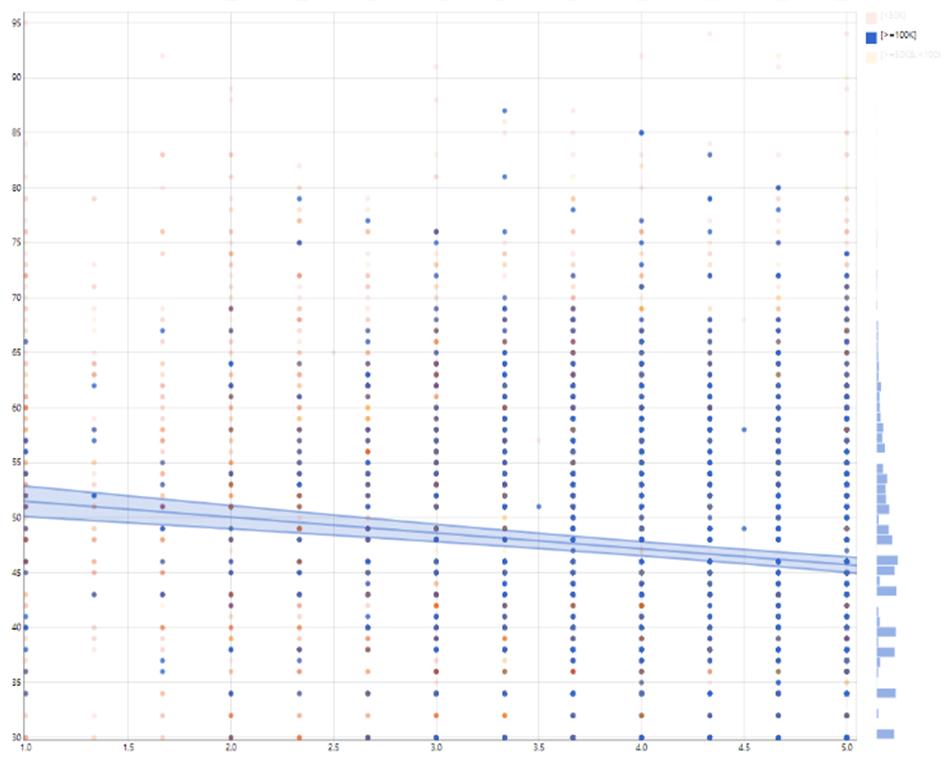
Figure 2-e: association among families with the highest income
X Axis: Parents’ Perceived Neighborhood Safety
Y Axis: Children’s Internalizing Symptoms
Figure 2. Association between subjective neighborhood safety and internalizing symptoms overall and by family income
As the interactions between parents’ subjective neighborhood safety and parental education were not significant, parental education did not seem to have a moderating effect on the association between parents’ subjective neighborhood safety and children’s internalizing symptoms. Similarly, the interactions between parents’ subjective neighborhood safety and family structure were not significant. Thus, family structure was found not to moderate the association between parents’ subjective neighborhood safety and children’s internalizing symptoms. As such, we did not show these lack of interaction effects.
Discussion
Overall, there is an association between parents’ perceived neighborhood safety and internalizing symptoms among American children. However, this association varies across racial and income groups. Compared to their White counterparts, Black and other race American families show a stronger inverse association between parents’ subjective neighborhood safety and children’s internalizing symptoms. Compared to their low-income counterparts, high-income American families may show a stronger inverse association between parents’ subjective neighborhood safety and children’s internalizing symptoms.
The first finding that parents’ subjective neighborhood safety is linked to internalizing symptoms among children is in line with past work by many scholars as well as our group. In a nationally representative study, we showed neighborhood safety to predict clinical depression for Black youth9. Diez Roux110-112, Galea113, and other colleagues have shown the relevance of neighborhood safety and quality as determinants of depression for adults. Research by others also has established a link between safe neighborhoods and lower risks of depression and depressive symptoms114. Our studies show that fear of crime, fear of neighborhood violence, and risk of victimization in the neighborhood may increase clinical and subclinical depression and other emotional and behavioral problems in youth and adults9,32,69,72. These are in part because low neighborhood safety is a type of stress113 and the role of various types of stress on the emotional and behavioral well-being of youth and adults are well established115.
Racial variation in the effects of parents’ subjective neighborhood safety on internalizing symptoms was expected. However, we did not expect a stronger inverse association for Black and Other/Mixed race compared to White children. This finding is not in line with Marginalization-related Diminished Returns (MDRs; diminished returns of resources for racialized families). Extensive work on MDRs has shown that individual-level and family-level SES and even neighborhood safety may show weaker health effects for Black people compared to Whites116-119. Weaker, not stronger, associations of individual-level and family-level resources are repeatedly established for Black individuals and families. These diminishing returns of family-level SES are robust as they hold across resources, developmental phases, outcomes, and marginalization types86,120. In most previous studies, Black families have shown less, not more, effects of income121, education117, employment122, and marital status123 on a wide range of emotional, behavioral, and health outcomes. Most of the past MDRs research, however, has focused on SES, not neighborhood effects on Black children121,124,125, adults118, and older adults126. It has been proposed that context may be a reason why we observe MDRs of SES indicators in Black125, Hispanic117,127-129, Asian American130, Native American131, LGBTQ116, and even marginalized White132 people.
The existing knowledge on racial and SES variation in the effects of subjective and objective indicators of neighborhood safety is limited. In one study, neighborhood safety better-promoted the life expectancy of White than Black adults70. Although the mechanisms that impact internalizing symptoms are undoubtedly different from those that impact mortality and other conditions, it is still unclear why for one outcome, Blacks, and for another outcome, Whites show a more substantial health effect of neighborhood safety70. In some other studies, the associations between financial difficulty and depression have been stronger in Black than White adults92,133-135.
Our findings also propose that different household incomes may be one reason racial groups differ in the effects of neighborhood safety on internalizing symptoms in children. This observation is in line with some past work118. Multiple studies have shown that, due to the labor market and housing discrimination, high SES Black families remain in worse neighborhoods, gain less income, and accumulate less wealth136-139. It is shown that due to structural racism, poor quality of education, labor market discrimination, and segregation, Black children attend worse schools across all SES levels140-143. In one study, income fully explained why education generated differential health effects for Black and White adults. Although outcomes, settings, and age groups are not comparable across all these studies, comparison of these results may shed some light on the role of differential income as a mechanism by which parental education is differently linked to health outcomes in Black and White families118.
This study used internalizing symptoms as the outcome. Internalizing symptoms and clinical and sub-clinical depression are shown to be more than expected in Black children from high SES families4,82,144-149. It is shown that parental education, household income, and own education show less protective effects for depression and internalizing symptoms in Black than White families4,82,144-149. In the ABCD data, parental education and household income better reduced internalizing symptoms, depression, and suicidal ideation of White than Black children82,85. In one study, high SES did increase, rather than reduce, the risk of major depressive disorder (MDD) for Black boys and men148,149. This is in part because high SES Black children and adults are frequently exposed to and are vulnerable to discrimination.
A wide range of societal mechanisms may alter how environmental conditions, resources, or assets may promote and how environmental risk factors may deteriorate outcomes across diverse racial groups. Racial minority communities, families, and individuals face a wide range of stressors that are not due to economic resources but social stratification and racism. These non-economic adversities are environmental, structural and are related to race, racialization, marginalization, and adversities that are seen across all economic levels150. Economic mobility's marginal health returns may be limited when the likelihood of upward social mobility is very slim for a specific group151. Increased exposure to stress is believed to reduce children's ability to gain from their available economic status resources such as parental education and income. For racial minority families, an increase in economic status may increase experience4,147,148,152,153 and vulnerability92 to discrimination. This might be because non-White families who have economic resources are more likely to be surrounded by White families, which increases their exposure to discriminatory events4,147. High levels of race-related (discrimination) and general stress, and neighborhood fear and violence, may operate as risk factors for many outcomes, including but not limited to depressive symptoms, and may reduce the return of SES and other economic resources on children’s outcomes92,148,154.
Residential segregation, school segregation, and job segregation may be other reasons why we observe differences across racial groups in their contextual exposures, such as neighborhood fear of violence. As a result of residential and school segregation, neighborhood and school options are limited for racial minority children across all economic levels. Racial minority children are sent to poor schools located in highly segregated areas, which is even true for families with economic resources141,143,155. This results in the differential effects of resources and environmental factors on children's education and schooling across diverse racial groups. For example, it is shown that while high SES White children attend resourced schools that are located in suburban areas with available funding and highly prepared teachers, racial minority children are sent to schools that have lower levels of resources and less prepared teachers51.
Scholars have recently studied the life experiences of middle-class Black families156,157. This research line has shown that middle-class families of color, particularly Blacks, experience their class and social status differently compared to their middle-class White counterparts. Research has shown that high SES may even operate as a source of vulnerability for diverse racial minority families by increasing exposure and sensitivity to Discrimination. Middle-class Black families live and work at increased proximity to White families, which is shown to increase their discrimination152,153,158-161.
Multiple competing and complementary models have been proposed and used to study the simultaneous and joint effects of race, SES, and neighborhood safety on children's emotional and behavioral outcomes. One approach, which has traditionally and historically dominated the field, attributes racial gaps in children's outcomes to the scarcity of economic resources and high prevalence of risk factors in the lives of racial minority families162-165. Some researchers who follow this line of work have suggested that economic status may partially mediate the effects of race on children's outcomes166-168. This research advocate for enhancing racial minority groups' economic status and improving their neighborhood conditions as the main strategies to close the existing racial inequalities169,170.
We did not find support for Marginalization-related Diminished Returns (MDRs)86,120. The MDRs framework argues that resources and assets may have differential effects on generating outcomes across racial groups due to social stratification and racism. MDRs are defined that weaker effects of economic resources and assets on tangible outcomes of racial minorities than White families. This model has received overwhelming support suggesting as various indicators such as subjective neighborhood safety67,92, parental education171, family income121,125, employment122, and marital status172 have weaker correlations with desired outcomes for racial minority, particularly Black families. Well-documented by the existing MDRs literature, economic resources of oneself117 and one's parents139,173,174 generate fewer desired outcomes for racial minority groups. Racial minority groups differ in their opportunities to mobilize their economic resources in order to secure tangible outcomes118,120,121,123,174,175. Given the existing MDRs, Black children may develop worse than expected outcomes compared to White children when their known-risk and protective factors are controlled because of racism and racialization, which is difficult to measure. MDRs are shown across economic and health outcomes86,120,121,124,125. While these MDRs are shown for SES effects on attention67, impulsivity121, inhibitory control80,176, and reward orientation84,177, we are not aware of studies on neighborhood effects on internalizing symptoms.
The third group of models used to study interactive effects of race, SES, neighborhood conditions, and health outcomes is double/triple/multiple jeopardies or cumulative disadvantages178-183. These models suggest that the effects of one additional risk factor would be larger at the bottom of the society and for racial minority populations. The argument behind these models is that risk factors and adversities increase the detrimental effect of any additional risk factor. These frameworks use the term vulnerable for minority populations, suggesting that they are more sensitive to risk factors178-183. Our observation on the stronger association between parents’ subjective neighborhood safety and children’s internalizing symptoms in Black than White families was in line with these frameworks.
Study Limitation
Our study had a few methodological limitations. Cross-sectional studies cannot establish causal associations. Thus, this study did not report the causes of children's internalizing symptoms. We only tested the associations between neighborhood safety and internalizing symptoms rather than clinical depression or conduct disorder. While we included SES indicators such as household income and parental education, other SES indicators such as family wealth were not included. This study did include subjective aspects of social context, however, it did not include various aspects of physical environment. Future research may study if diverse racial groups also differ in the effects of objective and subjective physical environment on developmental, behavioral, and emotional outcomes.
Conclusion
Racial and income groups differ in the association between neighborhood safety and children's internalizing symptoms. Children's internalizing symptoms are shaped by complex interactions between group membership and social factors such as perceived neighborhood safety. That means pathways and mechanisms that predict the emotional outcomes of children vary across racial and SES groups. This preliminary observation suggests that neighborhood safety may have different salience as a social determinant of emotional well-being for American children with diverse racial and economic backgrounds. There is a need to test the replicability of these findings using longitudinal data. There is also a need to conduct further research on neighborhood safety effects on clinical diagnosis of depression.
Funding
Data used in the preparation of this article were obtained from the Adolescent Brain Cognitive Development (ABCD) Study (https://abcdstudy.org), held in the NIMH Data Archive (NDA). The ABCD Study is supported by the National Institutes of Health (NIH) and additional federal partners under award numbers U01DA041022, U01DA041025, U01DA041028, U01DA041048, U01DA041089, U01DA041093, U01DA041106, U01DA041117, U01DA041120, U01DA041134, U01DA041148, U01DA041156, U01DA041174, U24DA041123, and U24DA041147. A full list of federal partners is available at https://abcdstudy.org/federal-partners.html. A listing of participating sites and a complete listing of the study investigators can be found at https://abcdstudy.org/principal-investigators.html. This manuscript reflects the views of the authors and may not reflect the opinions or views of the NIH or ABCD consortium investigators. ABCD consortium investigators designed and implemented the study and/or provided data but did not necessarily participate in analysis or writing of this report. The ABCD data repository grows and changes over time. The current paper used the Curated Annual Release 2.0, also defined in NDA Study 634 (doi:10.15154/1503209). DEAP is a software provided by the Data Analysis and Informatics Center of ABCD located at the UC San Diego with generous support from the National Institutes of Health and the Centers for Disease Control and Prevention under award number U24DA041123. The DEAP project information and links to its source code are available under the resource identifier RRID: SCR_016158. This study is supported by the following National Institutes of Health (NIH) awards: CA201415 02, D084526-03, U54MD007598, DA035811-05, U54MD008149and U54CA229974.
Appendix
Model Formula
Model 1
asr_scr_internal_t ~ neighb_phenx_ss_mean_p + race.4level + high.educ.bl + married.bl + age + sex + hisp + household.income.bl
Random: ~(1|abcd_site/rel_family_id)
Model 2
asr_scr_internal_t ~ neighb_phenx_ss_mean_p + race.4level + high.educ.bl + married.bl + age + sex + hisp + neighb_phenx_ss_mean_p * race.4level
Random: ~(1|abcd_site/rel_family_id)
Model 3
asr_scr_internal_t ~ neighb_phenx_ss_mean_p + race.4level + high.educ.bl + married.bl + age + sex + hisp + household.income.bl + neighb_phenx_ss_mean_p * race.4level
Random: ~(1|abcd_site/rel_family_id)
Model 4
asr_scr_internal_t ~ neighb_phenx_ss_mean_p + household.income.bl + race.4level + married.bl + age + sex + hisp
Random: ~(1|abcd_site/rel_family_id)
Model 5
asr_scr_internal_t ~ neighb_phenx_ss_mean_p + household.income.bl + race.4level + married.bl + age + sex + hisp + neighb_phenx_ss_mean_p * household.income.bl
Random: ~(1|abcd_site/rel_family_id)
References
- Benner AD, Crosnoe R. The racial/ethnic composition of elementary schools and young children’s academic and socioemotional functioning. American Educational Research Journal. 2011; 48, 621-646.
- De Feyter JJ, Winsler A. The early developmental competencies and school readiness of low-income, immigrant children: Influences of generation, race/ethnicity, and national origins. Early childhood research quarterly. 2009; 24, 411-431.
- Duncan AF, Watterberg KL, Nolen TL, et al. Effect of ethnicity and race on cognitive and language testing at age 18-22 months in extremely preterm infants. The Journal of pediatrics. 2012; 160, 966-971. e962.
- Assari S, Gibbons FX, Simons R. Depression among Black Youth, Interaction of Class and Place. Brain Sci. 2018; 8, doi:10.3390/brainsci8060108.
- Elm JHL. Adverse Childhood Experiences and Internalizing Symptoms Among American Indian Adults with Type 2 Diabetes. J Racial Ethn Health Disparities. 2020; 10.1007/s40615-020-00720-y, doi:10.1007/s40615-020-00720-y.
- McLaughlin KA, Hilt LM, Nolen-Hoeksema S. Racial/ethnic differences in internalizing and externalizing symptoms in adolescents. J Abnorm Child Psychol. 2007; 35, 801-816, doi:10.1007/s10802-007-9128-1.
- Miller B, Taylor J. Racial and socioeconomic status differences in depressive symptoms among black and white youth: an examination of the mediating effects of family structure, stress and support. J Youth Adolesc. 2012; 41, 426-437, doi:10.1007/s10964-011-9672-4.
- Schilling EA, Aseltine RH Jr, Gore S. Adverse childhood experiences and mental health in young adults: a longitudinal survey. BMC Public Health. 2007; 7, 30, doi:10.1186/1471-2458-7-30.
- Assari S, Caldwell CH. Neighborhood Safety and Major Depressive Disorder in a National Sample of Black Youth; Gender by Ethnic Differences. Children (Basel). 2017; 4, doi:10.3390/children4020014.
- Assari S. Additive Effects of Anxiety and Depression on Body Mass Index among Blacks: Role of Ethnicity and Gender. Int Cardiovasc Res J. 2014; 8, 44-51.
- Assari S, Bazargan M. Baseline Obesity Increases 25-Year Risk of Mortality due to Cerebrovascular Disease: Role of Race. Int J Environ Res Public Health. 2019; 16, doi:10.3390/ijerph16193705.
- Assari S, Caldwell CH. Gender and Ethnic Differences in the Association Between Obesity and Depression Among Black Adolescents. J Racial Ethn Health Disparities. 2015; 2, 481-493, doi:10.1007/s40615-015-0096-9.
- Assari S, Mistry R, Caldwell CH, et al. Marijuana Use and Depressive Symptoms; Gender Differences in African American Adolescents. Front Psychol. 2018; 9, 2135, doi:10.3389/fpsyg.2018.02135.
- Assari S. Psychosocial Correlates of Body Mass Index in the United States: Intersection of Race, Gender and Age. Iran J Psychiatry Behav Sci. 2016; 10, e3458, doi:10.17795/ijpbs-3458.
- Assari S, Boyce S, Bazargan M. Nucleus Accumbens Functional Connectivity with the Frontoparietal Network Predicts Subsequent Change in Body Mass Index for American Children. Brain Sci. 2020; 10, doi:10.3390/brainsci10100703.
- Assari S, Caldwell CH, Zimmerman MA. Depressive Symptoms During Adolescence Predict Adulthood Obesity Among Black Females. J Racial Ethn Health Disparities. 2018; 5, 774-781, doi:10.1007/s40615-017-0422-5.
- Assari S, Moazen-Zadeh E, Lankarani MM, et al. Race, Depressive Symptoms, and All-Cause Mortality in the United States. Front Public Health. 2016; 4, 40, doi:10.3389/fpubh.2016.00040.
- Carter JD, Assari S. Sustained Obesity and Depressive Symptoms over 6 Years: Race by Gender Differences in the Health and Retirement Study. Front Aging Neurosci. 2016; 8, 312, doi:10.3389/fnagi.2016.00312.
- Cuevas AG, Greatorex-Voith S, Assari S, et al. Longitudinal analysis of psychosocial stressors and body mass index in middle-aged and older adults in the United States. J Gerontol B Psychol Sci Soc Sci. 2020; 10.1093/geronb/gbaa142, doi:10.1093/geronb/gbaa142.
- Cohen GL, Sherman DK. Stereotype threat and the social and scientific contexts of the race achievement gap. Am Psychol. 2005; 60, 270-271; discussion 271-272, doi:10.1037/0003-066X.60.3.270.
- Burchinal M, McCartney K, Steinberg L, et al. Examining the Black-White achievement gap among low-income children using the NICHD study of early child care and youth development. Child Dev. 2011; 82, 1404-1420, doi:10.1111/j.1467-8624.2011.01620.x.
- Gorey K.M. Comprehensive School Reform: Meta-Analytic Evidence of Black-White Achievement Gap Narrowing. Educ Policy Anal Arch. 2009; 17, 1-17.
- Hair NL, Hanson JL, Wolfe BL, et al. Association of Child Poverty, Brain Development, and Academic Achievement. JAMA Pediatr. 2015; 169, 822-829, doi:10.1001/jamapediatrics.2015.1475.
- Valencia MLC, Tran BT, Lim MK, et al. Association Between Socioeconomic Status and Early Initiation of Smoking, Alcohol Drinking, and Sexual Behavior Among Korean Adolescents. Asia Pac J Public Health. 2019; 31, 443-453, doi:10.1177/1010539519860732.
- Ahmad A, Zulaily N, Shahril MR, et al. Association between socioeconomic status and obesity among 12-year-old Malaysian adolescents. PLoS One. 2018; 13, e0200577, doi:10.1371/journal.pone.0200577.
- Merz EC, Tottenham N, Noble KG. Socioeconomic Status, Amygdala Volume, and Internalizing Symptoms in Children and Adolescents. J Clin Child Adolesc Psychol. 2018; 47, 312-323, doi:10.1080/15374416.2017.1326122.
- Dismukes A, Shirtcliff E, Jones CW, et al. The development of the cortisol response to dyadic stressors in Black and White infants. Dev Psychopathol. 2018; 30, 1995-2008, doi:10.1017/S0954579418001232.
- Hanson JL, Nacewicz BM, Sutterer MJ, et al. Behavioral problems after early life stress: contributions of the hippocampus and amygdala. Biol Psychiatry. 2015; 77, 314-323, doi:10.1016/j.biopsych.2014.04.020.
- DeSantis AS, Adam EK, Doane LD, et al. Racial/ethnic differences in cortisol diurnal rhythms in a community sample of adolescents. J Adolesc Health. 2007; 41, 3-13, doi:10.1016/j.jadohealth.2007.03.006.
- Zimmerman MA, Brenner AB. Resilience in adolescence: Overcoming neighborhood disadvantage. 2010.
- Brenner AB, Bauermeister JA, Zimmerman MA. Neighborhood variation in adolescent alcohol use: Examination of socioecological and social disorganization theories. Journal of studies on alcohol and drugs. 2011; 72, 651-659.
- Assari S, Smith JR, Caldwell CH, et al. Gender differences in longitudinal links between neighborhood fear, parental support, and depression among African American emerging adults. Societies. 2015; 5, 151-170.
- Sharkey P, Elwert F. The legacy of disadvantage: Multigenerational neighborhood effects on cognitive ability. American journal of sociology. 2011; 116, 1934-1981.
- Aneshensel CS, Ko MJ, Chodosh J, et al. The urban neighborhood and cognitive functioning in late middle age. Journal of Health and Social Behavior. 2011; 52, 163-179.
- Caughy MOB, O'campo PJ. Neighborhood poverty, social capital, and the cognitive development of African American preschoolers. American journal of community psychology. 2006; 37, 141.
- Shih RA, Ghosh-Dastidar B, Margolis KL, et al. Neighborhood socioeconomic status and cognitive function in women. American journal of public health. 2011; 101, 1721-1728.
- Sisco SM, Marsiske M. Neighborhood influences on late life cognition in the ACTIVE study. Journal of Aging Research. 2012.
- Assari S, Caldwell CH, Zimmerman MA. Low parental support in late adolescence predicts obesity in young adulthood; Gender differences in a 12-year cohort of African Americans. J Diabetes Metab Disord. 2015; 14, 47, doi:10.1186/s40200-015-0176-8.
- Coman EN, Wu HZ, Assari, S. Exploring Causes of Depression and Anxiety Health Disparities (HD) by Examining Differences between 1:1 Matched Individuals. Brain Sci. 2018; 8, doi:10.3390/brainsci8120207.
- Alvarado SE. The impact of childhood neighborhood disadvantage on adult joblessness and income. Soc Sci Res. 2018; 70, 1-17, doi:10.1016/j.ssresearch.2017.10.004.
- Barreto SM, de Figueiredo RC, Giatti L. Socioeconomic inequalities in youth smoking in Brazil. BMJ Open. 2013; 3, e003538, doi:10.1136/bmjopen-2013-003538.
- Schreier HM, Chen E. Socioeconomic status and the health of youth: a multilevel, multidomain approach to conceptualizing pathways. Psychol Bull. 2013; 139, 606-654, doi:10.1037/a0029416.
- Hemovich V, Lac A, Crano W.D. Understanding early-onset drug and alcohol outcomes among youth: the role of family structure, social factors, and interpersonal perceptions of use. Psychol Health Med. 2011; 16, 249-267, doi:10.1080/13548506.2010.532560.
- Yelin E, Trupin L, Bunde J, et al. Poverty, Neighborhoods, Persistent Stress, and Systemic Lupus Erythematosus Outcomes: A Qualitative Study of the Patients' Perspective. Arthritis Care Res (Hoboken). 2019; 71, 398-405, doi:10.1002/acr.23599.
- Harnett NG, Wheelock MD, Wood KH, et al. Negative life experiences contribute to racial differences in the neural response to threat. Neuroimage. 2019; 202, 116086, doi:10.1016/j.neuroimage.2019.116086.
- Schulz AJ, Mentz G, Lachance L, et al. Associations between socioeconomic status and allostatic load: effects of neighborhood poverty and tests of mediating pathways. Am J Public Health. 2012; 102, 1706-1714, doi:10.2105/AJPH.2011.300412.
- Cummings JR. Contextual socioeconomic status and mental health counseling use among US adolescents with depression. J Youth Adolesc. 2014; 43, 1151-1162, doi:10.1007/s10964-013-0021-7.
- Takada M, Kondo N, Hashimoto H, et al. Japanese study on stratification, health, income, and neighborhood: study protocol and profiles of participants. J Epidemiol. 2014; 24, 334-344, doi:10.2188/jea.je20130084.
- Nogueira GJ, Castro A, Naveira L, et al. Evaluation of the higher brain functions in 1st and 7th grade schoolchildren belonging to two different socioeconomic groups. Rev Neurol. 2005; 40, 397-406.
- Richards M, James SN, Sizer A, et al. Identifying the lifetime cognitive and socioeconomic antecedents of cognitive state: seven decades of follow-up in a British birth cohort study. BMJ Open. 2019; 9, e024404, doi:10.1136/bmjopen-2018-024404.
- Jefferson AL, Gibbons LE, Rentz DM, et al. A life course model of cognitive activities, socioeconomic status, education, reading ability, and cognition. J Am Geriatr Soc. 2011; 59, 1403-1411, doi:10.1111/j.1532-5415.2011.03499.x.
- Manly JJ, Jacobs DM, Touradji P, et al. Reading level attenuates differences in neuropsychological test performance between African American and White elders. J Int Neuropsychol Soc. 2002; 8, 341-348, doi:10.1017/s1355617702813157.
- Larson K, Russ SA, Nelson BB, et al. Cognitive ability at kindergarten entry and socioeconomic status. Pediatrics. 2015; 135, e440-448, doi:10.1542/peds.2014-0434.
- Vargas T, Rakhshan Rouhakhtar PJ, Schiffman J, et al. Neighborhood crime, socioeconomic status, and suspiciousness in adolescents and young adults at Clinical High Risk (CHR) for psychosis. Schizophr Res. 2020; 215, 74-80, doi:10.1016/j.schres.2019.11.024.
- Gerra G, Benedetti E, Resce G, et al. Socioeconomic Status, Parental Education, School Connectedness and Individual Socio-Cultural Resources in Vulnerability for Drug Use among Students. Int J Environ Res Public Health. 2020; 17, doi:10.3390/ijerph17041306.
- Rodriguez JM, Karlamangla AS, Gruenewald TL, et al. Social stratification and allostatic load: shapes of health differences in the MIDUS study in the United States. J Biosoc Sci. 2019; 10.1017/S0021932018000378, 1-18, doi:10.1017/S0021932018000378.
- Schibli K, Wong K, Hedayati N, et al. Attending, learning, and socioeconomic disadvantage: developmental cognitive and social neuroscience of resilience and vulnerability. Ann N Y Acad Sci. 2017; 1396, 19-38, doi:10.1111/nyas.13369.
- Kelishadi R, Jari M, Qorbani M, et al. Does the socioeconomic status affect the prevalence of psychiatric distress and violent behaviors in children and adolescents? The CASPIAN-IV study. Minerva Pediatr. 2017; 69, 264-273, doi:10.23736/S0026-4946.16.04266-3.
- Poh BK, Lee ST, Yeo GS, et al. Low socioeconomic status and severe obesity are linked to poor cognitive performance in Malaysian children. BMC Public Health. 2019; 19, 541, doi:10.1186/s12889-019-6856-4.
- Karlsson O, De Neve JW, Subramanian SV. Weakening association of parental education: analysis of child health outcomes in 43 low- and middle-income countries. Int J Epidemiol. 2018; 10.1093/ije/dyy158, doi:10.1093/ije/dyy158.
- Madhushanthi HJ, Wimalasekera SW, Goonewardena CSE, et al. Socioeconomic status is a predictor of neurocognitive performance of early female adolescents. Int J Adolesc Med Health. 2018; 10.1515/ijamh-2018-0024, doi:10.1515/ijamh-2018-0024.
- Christensen DL, Schieve LA, Devine O, et al. Socioeconomic status, child enrichment factors, and cognitive performance among preschool-age children: results from the Follow-Up of Growth and Development Experiences study. Res Dev Disabil. 2014; 35, 1789-1801, doi:10.1016/j.ridd.2014.02.003.
- Bouthoorn SH, Wijtzes AI, Jaddoe VW, et al. Development of socioeconomic inequalities in obesity among Dutch pre-school and school-aged children. Obesity (Silver Spring). 2014; 22, 2230-2237, doi:10.1002/oby.20843.
- Senn TE, Walsh JL, Carey MP. The mediating roles of perceived stress and health behaviors in the relation between objective, subjective, and neighborhood socioeconomic status and perceived health. Ann Behav Med. 2014; 48, 215-224, doi:10.1007/s12160-014-9591-1.
- Manuck SB, Phillips JE, Gianaros PJ, et al. Subjective socioeconomic status and presence of the metabolic syndrome in midlife community volunteers. Psychosom Med. 2010; 72, 35-45, doi:10.1097/PSY.0b013e3181c484dc.
- Wright CE, Steptoe A. Subjective socioeconomic position, gender and cortisol responses to waking in an elderly population. Psychoneuroendocrinology. 2005; 30, 582-590, doi:10.1016/j.psyneuen.2005.01.007.
- Assari S, Boyce S, Bazargan M. Subjective Family Socioeconomic Status and Adolescents’ Attention: Blacks’ Diminished Returns. Children. 2020; 7, 80.
- Moon C. Subjective economic status, sex role attitudes, fertility, and mother's work. Ingu Pogon Nonjip. 1987; 7, 177-196.
- Assari S, Moghani Lankarani M, Caldwell C.H, et al. Fear of Neighborhood Violence During Adolescence Predicts Development of Obesity a Decade Later: Gender Differences Among African Americans. Arch Trauma Res. 2016; 5, e31475, doi:10.5812/atr.31475.
- Assari S. Perceived Neighborhood Safety Better Predicts Risk of Mortality for Whites than Blacks. J Racial Ethn Health Disparities. 2016; 10.1007/s40615-016-0297-x, doi:10.1007/s40615-016-0297-x.
- Assari S, Boyce S, Caldwell CH, et al. Family Income and Gang Presence in the Neighborhood: Diminished Returns of Black Families. Urban Science. 2020; 4, 29.
- Assari S, Caldwell CH, Zimmerman MA. Perceived Neighborhood Safety During Adolescence Predicts Subsequent Deterioration of Subjective Health Two Decades Later; Gender Differences in a Racially-Diverse Sample. Int J Prev Med. 2015; 6, 117, doi:10.4103/2008-7802.170431.
- Nicksic NE, Salahuddin M, Butte NF, et al. Associations Between Parent-Perceived Neighborhood Safety and Encouragement and Child Outdoor Physical Activity Among Low-Income Children. J Phys Act Health. 2018; 15, 317-324, doi:10.1123/jpah.2017-0224.
- Singh GK, Ghandour RM. Impact of neighborhood social conditions and household socioeconomic status on behavioral problems among US children. Matern Child Health J. 2012; 16 Suppl 1, S158-169, doi:10.1007/s10995-012-1005-z.
- Westley T, Kaczynski AT, Stanis SAW, et al. Parental neighborhood safety perceptions and their children's health behaviors: Associations by child age, gender and household income. Children Youth and Environments. 2013; 23, 118-147.
- Ursache A, Noble KG, Blair C. Socioeconomic Status, Subjective Social Status, and Perceived Stress: Associations with Stress Physiology and Executive Functioning. Behav Med. 2015; 41, 145-154, doi:10.1080/08964289.2015.1024604.
- Feldman PJ, Steptoe A. How neighborhoods and physical functioning are related: the roles of neighborhood socioeconomic status, perceived neighborhood strain, and individual health risk factors. Ann Behav Med. 2004; 27, 91-99, doi:10.1207/s15324796abm2702_3.
- Assari S, Smith JL, Saqib M, et al. Binge Drinking among Economically Disadvantaged African American Older Adults with Diabetes. Behav Sci (Basel). 2019; 9, doi:10.3390/bs9090097.
- Assari S, Smith J, Mistry R, et al. Substance Use among Economically Disadvantaged African American Older Adults; Objective and Subjective Socioeconomic Status. Int J Environ Res Public Health. 2019; 16, doi:10.3390/ijerph16101826.
- Assari S. Parental Education on Youth Inhibitory Control in the Adolescent Brain Cognitive Development (ABCD) Study: Blacks' Diminished Returns. Brain Sci. 2020; 10, doi:10.3390/brainsci10050312.
- Assari S. Race, Ethnicity, Family Socioeconomic Status, and Children's Hippocampus Volume. Res Health Sci. 2020; 5, 25-45, doi:10.22158/rhs.v5n4p25.
- Assari S. Youth Social, Emotional, and Behavioral Problems in the ABCD Study: Minorities' Diminished Returns of Family Income. J Econ Public Financ. 2020; 6, 1-19, doi:10.22158/jepf.v6n4p1.
- Assari S. Racial Variation in the Association between Suicidal History and Positive and Negative Urgency among American Children. J Educ Cult Stud. 2020; 4, 39-53, doi:10.22158/jecs.v4n4p39.
- Assari S, Boyce S, Akhlaghipour G, et al. Reward Responsiveness in the Adolescent Brain Cognitive Development (ABCD) Study: African Americans’ Diminished Returns of Parental Education. Brain Sciences. 2020; 10, 391.
- Assari S, Boyce S, Bazargan M, et al. African Americans’ Diminished Returns of Parental Education on Adolescents’ Depression and Suicide in the Adolescent Brain Cognitive Development (ABCD) Study. European Journal of Investigation in Health, Psychology and Education. 2020; 10, 656-668.
- Assari S. Health Disparities due to Diminished Return among Black Americans: Public Policy Solutions. Social Issues and Policy Review. 2018; 12, 112-145, doi:10.1111/sipr.12042.
- Assari S. Unequal Gain of Equal Resources across Racial Groups. Int J Health Policy Manag. 2018; 7, 1-9, doi:10.15171/ijhpm.2017.90.
- Marmot M. The Status Syndrome: How Social Standing Affects Our Health and Longevity. London: Bloomsbury Press. 2004.
- Link BG, Phelan J. The social shaping of health and smoking. Drug Alcohol Depend. 2009; 104 Suppl 1, S6-10, doi:10.1016/j.drugalcdep.2009.03.002.
- Phelan JC, Link BG, Diez-Roux A, et al. "Fundamental causes" of social inequalities in mortality: a test of the theory. J Health Soc Behav. 2004; 45, 265-285, doi:10.1177/002214650404500303.
- Link BG, Phelan J. Social conditions as fundamental causes of disease. J Health Soc Behav. 1995; Spec No, 80-94.
- Assari S, Preiser B, Lankarani MM, et al. Subjective Socioeconomic Status Moderates the Association between Discrimination and Depression in African American Youth. Brain Sci. 2018; 8, doi:10.3390/brainsci8040071.
- Jacques T, Seitz AR. Moderating effects of visual attention and action video game play on perceptual learning with the texture discrimination task. Vision Res. 2020; 10.1016/j.visres.2020.02.003, doi:10.1016/j.visres.2020.02.003.
- King J, Markant J. Individual differences in selective attention and scanning dynamics influence children's learning from relevant non-targets in a visual search task. J Exp Child Psychol. 2020; 193, 104797, doi:10.1016/j.jecp.2019.104797.
- Alcohol Research: Current Reviews Editorial, S. NIH's Adolescent Brain Cognitive Development (ABCD) Study. Alcohol Res. 2018; 39, 97.
- Casey BJ, Cannonier T, Conley MI, et al. The Adolescent Brain Cognitive Development (ABCD) study: Imaging acquisition across 21 sites. Dev Cogn Neurosci. 2018; 32, 43-54, doi:10.1016/j.dcn.2018.03.001.
- Karcher NR, O'Brien KJ, Kandala S, et al. Resting-State Functional Connectivity and Psychotic-like Experiences in Childhood: Results From the Adolescent Brain Cognitive Development Study. Biol Psychiatry. 2019; 86, 7-15, doi:10.1016/j.biopsych.2019.01.013.
- Lisdahl KM, Sher KJ, Conway KP, et al. Adolescent brain cognitive development (ABCD) study: Overview of substance use assessment methods. Dev Cogn Neurosci. 2018; 32, 80-96, doi:10.1016/j.dcn.2018.02.007.
- Luciana M, Bjork JM, Nagel BJ, et al. Adolescent neurocognitive development and impacts of substance use: Overview of the adolescent brain cognitive development (ABCD) baseline neurocognition battery. Dev Cogn Neurosci. 2018; 32, 67-79, doi:10.1016/j.dcn.2018.02.006.
- Auchter AM, Mejia HM, Heyser CJ, et al. A description of the ABCD organizational structure and communication framework. Dev Cogn Neurosci. 2018; 32, 8-15, doi:10.1016/j.dcn.2018.04.003.
- Garavan H, Bartsch H, Conway K, et al. Recruiting the ABCD sample: Design considerations and procedures. Dev Cogn Neurosci. 2018; 32, 16-22, doi:10.1016/j.dcn.2018.04.004.
- Achenbach TM, Rescorla L. Manual for the ASEBA school-age forms & profiles: An integrated system of multi-informant assessment; Aseba Burlington, VT: 2001.
- Aebi M, Metzke WC, Steinhausen HC. Accuracy of the DSM-oriented attention problem scale of the child behavior checklist in diagnosing attention-deficit hyperactivity disorder. J Atten Disord. 2010; 13, 454-463, doi:10.1177/1087054708325739.
- Albores-Gallo L, Hernandez-Guzman L, Hasfura-Buenaga C, et al. Internal consistency and criterion validity and reliability of the Mexican Version of the Child Behavior Checklist 1.5-5 (CBCL/1.5-5). Rev Chil Pediatr. 2016; 87, 455-462, doi:10.1016/j.rchipe.2016.05.009.
- Albrecht G, Veerman JW, Damen H, et al. The Child Behavior Checklist for group care workers: a study regarding the factor structure. J Abnorm Child Psychol. 2001; 29, 83-89, doi:10.1023/a:1005255614039.
- Althoff RR, Rettew DC, Ayer LA, et al. Cross-informant agreement of the Dysregulation Profile of the Child Behavior Checklist. Psychiatry Res. 2010; 178, 550-555, doi:10.1016/j.psychres.2010.05.002.
- Ayer L, Althoff R, Ivanova M, et al. Child Behavior Checklist Juvenile Bipolar Disorder (CBCL-JBD) and CBCL Posttraumatic Stress Problems (CBCL-PTSP) scales are measures of a single dysregulatory syndrome. J Child Psychol Psychiatry. 2009; 50, 1291-1300, doi:10.1111/j.1469-7610.2009.02089.x.
- Beck B, Amon P, Castell R, et al. Reliability of the Child Behavior Checklist in a population of 6 to 8-year-old special education students. Z Kinder Jugendpsychiatr. 1993; 21, 101-108.
- Echeverria SE, Diez-Roux AV, Link BG. Reliability of self-reported neighborhood characteristics. Journal of Urban Health. 2004; 81, 682-701.
- Mair C, Roux AD, Galea S. Are neighbourhood characteristics associated with depressive symptoms? A review of evidence. Journal of Epidemiology & Community Health. 2008; 62, 940-946.
- Echeverría S, Diez-Roux AV, Shea S, et al. Associations of neighborhood problems and neighborhood social cohesion with mental health and health behaviors: the Multi-Ethnic Study of Atherosclerosis. Health & place. 2008; 14, 853-865.
- Henderson C, Roux AVD, Jacobs DR, et al. Neighbourhood characteristics, individual level socioeconomic factors, and depressive symptoms in young adults: the CARDIA study. Journal of Epidemiology & Community Health. 2005; 59, 322-328.
- Sampson L, Ettman CK, Galea S. Urbanization, urbanicity, and depression: a review of the recent global literature. Current Opinion in Psychiatry. 2020; 33, 233-244.
- Latkin CA, Curry AD. Stressful neighborhoods and depression: a prospective study of the impact of neighborhood disorder. Journal of health and social behavior. 2003; 34-44.
- Hammen C. Stress and depression. Annu. Rev. Clin. Psychol. 2005; 1, 293-319.
- Assari S. Education Attainment and ObesityDifferential Returns Based on Sexual Orientation. Behav Sci (Basel). 2019; 9, doi:10.3390/bs9020016.
- Assari S, Farokhnia M, Mistry R. Education Attainment and Alcohol Binge Drinking: Diminished Returns of Hispanics in Los Angeles. Behav Sci (Basel). 2019; 9, doi:10.3390/bs9010009.
- Assari S. Blacks' Diminished Return of Education Attainment on Subjective Health; Mediating Effect of Income. Brain Sci. 2018; 8, doi:10.3390/brainsci8090176.
- Assari S. Family Income Reduces Risk of Obesity for White but Not Black Children. Children (Basel). 2018; 5, doi:10.3390/children5060073.
- Assari S. Unequal Gain of Equal Resources across Racial Groups. Int J Health Policy Manag. 2017; 7, 1-9, doi:10.15171/ijhpm.2017.90.
- Assari S, Caldwell CH, Mincy R. Family Socioeconomic Status at Birth and Youth Impulsivity at Age 15; Blacks' Diminished Return. Children (Basel). 2018; 5, doi:10.3390/children5050058.
- Assari S. Life Expectancy Gain Due to Employment Status Depends on Race, Gender, Education, and Their Intersections. J Racial Ethn Health Disparities. 2018; 5, 375-386, doi:10.1007/s40615-017-0381-x.
- Assari S, Caldwell CH, Zimmerman MA. Family Structure and Subsequent Anxiety Symptoms; Minorities' Diminished Return. Brain Sci. 2018; 8, doi:10.3390/brainsci8060097.
- Assari S, Caldwell CH, Mincy RB. Maternal Educational Attainment at Birth Promotes Future Self-Rated Health of White but Not Black Youth: A 15-Year Cohort of a National Sample. J Clin Med. 2018; 7, doi:10.3390/jcm7050093.
- Assari S, Thomas A, Caldwell CH, et al. Blacks' Diminished Health Return of Family Structure and Socioeconomic Status; 15 Years of Follow-up of a National Urban Sample of Youth. J Urban Health. 2018; 95, 21-35, doi:10.1007/s11524-017-0217-3.
- Assari S, Lankarani MM. Education and Alcohol Consumption among Older Americans; Black-White Differences. Front Public Health. 2016; 4, 67, doi:10.3389/fpubh.2016.00067.
- Shervin A, Ritesh M. Diminished Return of Employment on Ever Smoking Among Hispanic Whites in Los Angeles. Health Equity. 2019; 3, 138-144, doi:10.1089/heq.2018.0070.
- Assari S. Socioeconomic Determinants of Systolic Blood Pressure; Minorities’ Diminished Returns. Journal of Health Economics and Development. 2019; 1, 1-11.
- Assari S. Socioeconomic Status and Self-Rated Oral Health; Diminished Return among Hispanic Whites. Dent J (Basel). 2018; 6, doi:10.3390/dj6020011.
- Assari S, Boyce S, Bazargan M, et al. Mathematical Performance of American Youth: Diminished Returns of Educational Attainment of Asian-American Parents. Education Sciences. 2020; 10, 32.
- Assari S, Bazargan M. Protective Effects of Educational Attainment Against Cigarette Smoking; Diminished Returns of American Indians and Alaska Natives in the National Health Interview Survey. International Journal of Travel Medicine and Global Health. 2019.
- Assari S, Boyce S, Bazargan M, et al. Place-Based Diminished Returns of Parental Educational Attainment on School Performance of Non-Hispanic White Youth. Frontiers in Education. 2020; 5, doi:10.3389/feduc.2020.00030.
- Assari S. Race, Depression, and Financial Distress in a Nationally Representative Sample of American Adults. Brain Sci. 2019; 9, doi:10.3390/brainsci9020029.
- Evans MC, Bazargan M, Cobb S, et al. Mental and Physical Health Correlates of Financial Difficulties Among African-American Older Adults in Low-Income Areas of Los Angeles. Front Public Health. 2020; 8, 21, doi:10.3389/fpubh.2020.00021.
- Evans MC, Cobb S, Smith J, et al. Depressive Symptoms among Economically Disadvantaged African American Older Adults in South Los Angeles. Brain Sci. 2019; 9, doi:10.3390/brainsci9100246.
- Assari S. Understanding America: Unequal Economic Returns of Years of Schooling in Whites and Blacks. World J Educ Res. 2020; 7, 78-92, doi:10.22158/wjer.v7n2p78.
- Assari S. College Graduation and Wealth Accumulation: Blacks' Diminished Returns. World J Educ Res. 2020; 7, 1-18, doi:10.22158/wjer.v7n3p1.
- Assari S, Preiser B, Kelly M. Education and Income Predict Future Emotional Well-Being of Whites but Not Blacks: A Ten-Year Cohort. Brain Sci. 2018; 8, doi:10.3390/brainsci8070122.
- Assari S. Parental Education Better Helps White than Black Families Escape Poverty: National Survey of Children’s Health. Economies. 2018; 6, 30.
- Boyce S, Bazargan M, Caldwell CH, et al. Parental Educational Attainment and Social Environment of Urban Public Schools in the U.S.: Blacks’ Diminished Returns. Children. 2020; 7, 44.
- Assari S. Parental Educational Attainment and Academic Performance of American College Students; Blacks’ Diminished Returns. Journal of Health Economics and Development. 2019; 1, 21-31.
- Assari S, Caldwell CH. Teacher Discrimination Reduces School Performance of African American Youth: Role of Gender. Brain Sci. 2018; 8, doi:10.3390/brainsci8100183.
- Assari S, Caldwell CH. Parental Educational Attainment Differentially Boosts School Performance of American Adolescents: Minorities' Diminished Returns. J Family Reprod Health. 2019; 13, 7-13.
- Assari S. Combined Effects of Race and Educational Attainment on Physician Visits Over 24 Years in a National Sample of Middle-Aged and Older Americans. Hosp Pract Res. 2020; 5, 17-23, doi:10.34172/hpr.2020.04.
- Assari S. Combined Effects of Ethnicity and Education on Burden of Depressive Symptoms over 24 Years in Middle-Aged and Older Adults in the United States. Brain Sci. 2020; 10, doi:10.3390/brainsci10040209.
- Assari S, Cobb S, Saqib M, et al. Economic Strain Deteriorates While Education Fails to Protect Black Older Adults Against Depressive Symptoms, Pain, Self-rated Health, Chronic Disease, and Sick Days. J Ment Health Clin Psychol. 2020; 4, 49-62, doi:10.29245/2578-2959/2020/2.1203.
- Assari S, Gibbons FX, Simons RL. Perceived Discrimination among Black Youth: An 18-Year Longitudinal Study. Behav Sci (Basel). 2018; 8, doi:10.3390/bs8050044.
- Assari S, Lankarani MM, Caldwell CH. Does Discrimination Explain High Risk of Depression among High-Income African American Men? Behav Sci (Basel). 2018; 8, doi:10.3390/bs8040040.
- Assari S, Caldwell CH. High Risk of Depression in High-Income African American Boys. J Racial Ethn Health Disparities. 2018; 5, 808-819, doi:10.1007/s40615-017-0426-1.
- Bowden M, Bartkowski J, Xu X, et al. Parental occupation and the gender math gap: Examining the social reproduction of academic advantage among elementary and middle school students. Social Sciences. 2017; 7, 6.
- Chetty R, Hendren N, Kline P, et al. Where is the land of opportunity? The geography of intergenerational mobility in the United States. The Quarterly Journal of Economics. 2014; 129, 1553-1623.
- Assari S. Does School Racial Composition Explain Why High Income Black Youth Perceive More Discrimination? A Gender Analysis. Brain Sci. 2018; 8, doi:10.3390/brainsci8080140.
- Assari S, Lankarani MM. Workplace Racial Composition Explains High Perceived Discrimination of High Socioeconomic Status African American Men. Brain Sci. 2018; 8, doi:10.3390/brainsci8080139.
- Assari S, Caldwell CH. Social Determinants of Perceived Discrimination among Black Youth: Intersection of Ethnicity and Gender. Children (Basel). 2018; 5, doi:10.3390/children5020024.
- Assari S. Parental Educational Attainment and Academic Performance of American College Students; Blacks' Diminished Returns. J Health Econ Dev. 2019; 1, 21-31.
- Chiteji NS, Hamilton D. Family connections and the black-white wealth gap among middle-class families. The Review of Black Political Economy. 2002; 30, 9-28.
- Weitzman M, Byrd RS, Auinger P. Black and white middle class children who have private health insurance in the United States. Pediatrics. 1999; 104, 151-157.
- Bailey ZD, Krieger N, Agenor M, et al. Structural racism and health inequities in the USA: evidence and interventions. Lancet. 2017; 389, 1453-1463, doi:10.1016/S0140-6736(17)30569-X.
- Hudson DL, Bullard KM, Neighbors HW, et al. Are benefits conferred with greater socioeconomic position undermined by racial discrimination among African American men? J Mens Health. 2012; 9, 127-136, doi:10.1016/j.jomh.2012.03.006.
- Hudson DL, Neighbors HW, Geronimus AT, et al. Racial Discrimination, John Henryism, and Depression Among African Americans. J Black Psychol. 2016; 42, 221-243, doi:10.1177/0095798414567757.
- Hudson DL, Puterman E, Bibbins-Domingo K, et al. Race, life course socioeconomic position, racial discrimination, depressive symptoms and self-rated health. Soc Sci Med. 2013; 97, 7-14, doi:10.1016/j.socscimed.2013.07.031.
- Kaufman JS, Cooper RS, McGee DL. Socioeconomic status and health in blacks and whites: the problem of residual confounding and the resiliency of race. Epidemiology. 1997; 621-628.
- Bell CN, Sacks TK, Tobin TCS, et al. Racial Non-equivalence of Socioeconomic Status and Self-rated Health among African Americans and Whites. SSM Popul Health. 2020; 10, 100561, doi:10.1016/j.ssmph.2020.100561.
- Samuel LJ, Roth DL, Schwartz BS, et al. Socioeconomic Status, Race/Ethnicity, and Diurnal Cortisol Trajectories in Middle-Aged and Older Adults. J Gerontol B Psychol Sci Soc Sci. 2018; 73, 468-476, doi:10.1093/geronb/gbw080.
- Fuentes M, Hart-Johnson T, Green CR. The association among neighborhood socioeconomic status, race and chronic pain in black and white older adults. J Natl Med Assoc. 2007; 99, 1160-1169.
- Assari S, Khoshpouri P, Chalian H. Combined Effects of Race and Socioeconomic Status on Cancer Beliefs, Cognitions, and Emotions. Healthcare (Basel). 2019; 7, doi:10.3390/healthcare7010017.
- Assari S. Number of Chronic Medical Conditions Fully Mediates the Effects of Race on Mortality; 25-Year Follow-Up of a Nationally Representative Sample of Americans. J Racial Ethn Health Disparities. 2017; 4, 623-631, doi:10.1007/s40615-016-0266-4.
- Assari S. Distal, intermediate, and proximal mediators of racial disparities in renal disease mortality in the United States. J Nephropathol. 2016; 5, 51-59, doi:10.15171/jnp.2016.09.
- Williams DR, Costa MV, Odunlami AO, et al. Moving upstream: how interventions that address the social determinants of health can improve health and reduce disparities. J Public Health Manag Pract. 2008; 14 Suppl, S8-17, doi:10.1097/01.PHH.0000338382.36695.42.
- Williams DR. Race, socioeconomic status, and health the added effects of racism and discrimination. 1999.
- Assari S, Caldwell CH, Bazargan M. Association Between Parental Educational Attainment and Youth Outcomes and Role of Race/Ethnicity. JAMA Netw Open. 2019; 2, e1916018, doi:10.1001/jamanetworkopen.2019.16018.
- Assari S, Bazargan M. Being Married Increases Life Expectancy of White but Not Black Americans. J Family Reprod Health. 2019; 13, 132-140.
- Assari S. Parental Education Attainment and Educational Upward Mobility; Role of Race and Gender. Behav Sci (Basel). 2018; 8, doi:10.3390/bs8110107.
- Assari S. Parental Educational Attainment and Mental Well-Being of College Students; Diminished Returns of Blacks. Brain Sci. 2018; 8, doi:10.3390/brainsci8110193.
- Assari S, Hani N. Household Income and Children's Unmet Dental Care Need; Blacks' Diminished Return. Dent J (Basel). 2018; 6, doi:10.3390/dj6020017.
- Assari S, Akhlaghipour G. Not Race or Age but Their Interaction Predicts Pre-Adolescents' Inhibitory Control. Child Teenagers. 2020; 3, 50-71, doi:10.22158/ct.v3n2p50.
- Assari S, Akhlaghipour G, Boyce S, et al. African American Children’s Diminished Returns of Subjective Family Socioeconomic Status on Fun Seeking. Children. 2020; 7, 75.
- King DK. Multiple jeopardy, multiple consciousness: The context of a Black feminist ideology. Signs: Journal of Women in Culture and Society. 1988; 14, 42-72.
- Gerber LM. Multiple jeopardy: A socioeconomic comparison of men and women among the Indian, Metis and Inuit peoples of Canada. Canadian Ethnic Studies= Etudes Ethniques au Canada. 1990; 22, 69.
- Barnet B, Liu J, Devoe M. Double jeopardy: depressive symptoms and rapid subsequent pregnancy in adolescent mothers. Arch Pediatr Adolesc Med. 2008; 162, 246-252, doi:10.1001/archpediatrics.2007.60.
- Greenman E, Xie Y. Double Jeopardy? The Interaction of Gender and Race on Earnings in the U.S. Soc Forces. 2008; 86, 1217-1244, doi:10.1353/sof.0.0008.
- Lefler LL, Nuss RL. Double jeopardy! Heart disease risk factors for older African American and Caucasian women. Medsurg Nurs. 2009; 18, 347-354.
- Habib RR, Yassin N, Ghanawi J, et al. Double jeopardy: assessing the association between internal displacement, housing quality and chronic illness in a low-income neighborhood. Z Gesundh Wiss. 2011; 19, 171-182, doi:10.1007/s10389-010-0368-0.